GBP/USD dives to multi-week lows amid USD strength, eyes on BoE
- GBP/USD dropped more than 0.80%, testing the 1.2750 zone.
- British and American Manufacturing sectors showed weakness in July.
- US JOLTs figures hinted at some softness in the labour market. Eyes on additional ADP, NFPs and Claims.

The GBP weakened on Tuesday against the USD as the Greenback gained ground against most of its rivals. Ahead of Thursday’s Bank of England (BoE) decision, the weak British made the GBP lose interest while markets await key labour data from the US. Economic data reported on the session from the US came in weak, but the DXY index hold gains above 102.00.
On Tuesday’s session, the US reported mid-tier data. Though slightly below forecast at 46.4, the US ISM July PMI increased from the previous reading of 46. Job Openings on JOLT fell short of expectations, coming in at 9.58M instead of 9.62M. According to Fed Chairman Powell, the economy is resilient, but decisions about the future will be made based on new information, which could lead to volatility in USD price dynamics. This week, investors will be closely watching ADP job employment change, Jobless Claims, and Nonfarm Payrolls to begin placing bets on the upcoming Fed meetings.
On the other hand, the manufacturing PMI released by the Chartered Institute of Purchasing & Supply and S&P Global stood in contraction territory in July, coming in at 45.3, slightly higher than the 45 expected. That said, the focus is on Thursday’s Bank of England (BoE) decision, where markets anticipate a 25 bps hike. Investors will also closely monitor Andrew Bailey’s words to find clues regarding forward guidance.
GBP/USD Levels to watch
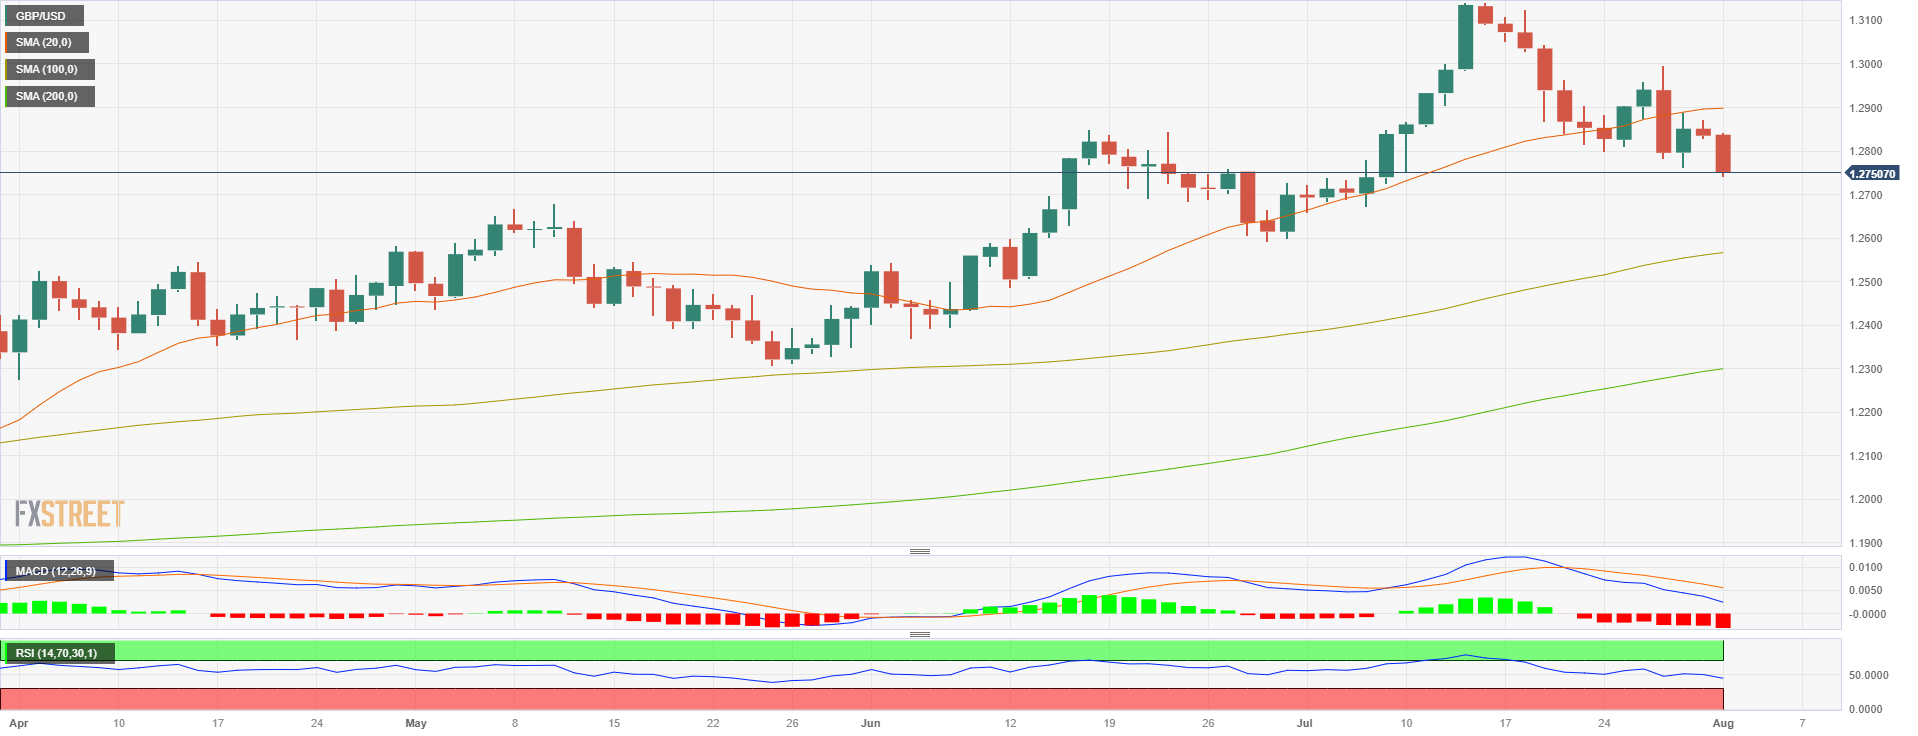
The GBP/USD indicates a neutral to bearish technical outlook on the daily chart, suggesting that the bulls might be losing steam on the short term. The Relative Strength Index (RSI) shows a negative slope and fell below its midline, and the Moving Average Convergence Divergence (MACD) displays fading green bars. Moreover, in the bigger picture, the pair is below the 20-day Simple Moving Average (SMA) but above the 100 and 200-day SMAs, indicating that the bulls still have the upper hand.
Support levels: 1.2730, 1.2710, 1.2700.
Resistance levels: 1.2830, 1.2850,1.2900 (20-day SMA).
GBP/USD Daily chart
Author

Patricio Martín
FXStreet
Patricio is an economist from Argentina passionate about global finance and understanding the daily movements of the markets.


