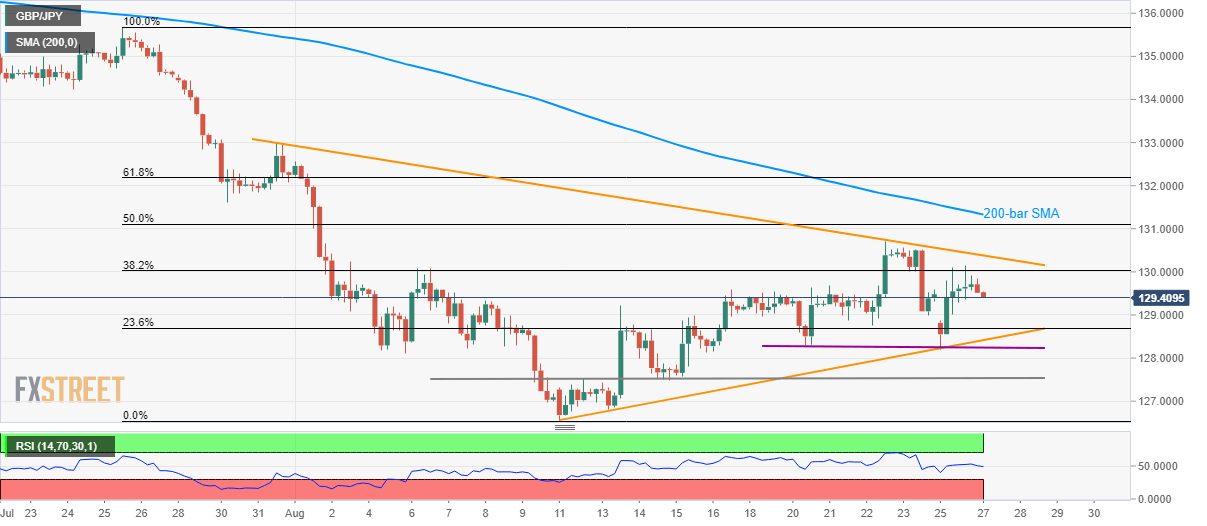
GBP/JPY technical analysis: Inside symmetrical triangle below 200-bar SMA
- Nearly four-week-old symmetrical triangle limits GBP/JPY moves below 200-bar SMA.
- 128.26/20 and 127.56/47 offer additional supports during the downside break.

GBP/JPY keeps taking the rounds of a near-term symmetrical triangle as it trades around 129.50 during Tuesday’s Asian session.
In addition to the formation’s resistance-line near 130.40, 200-bar simple moving average (SMA) of 131.33 also limits the quote’s upside ahead of fuelling it to July 31 top at 133.
Alternatively, 128.26/20 and 127.56/47 can question the pair’s downside after the break of pattern support, at 128.42 now.
Given the pair’s sustained trading below the key moving average, odds of its downpour are high, which in turn increases the importance of monthly low, at 126.54, for sellers on the break of 127.57 horizontal support.
GBP/JPY 4-hour chart
Trend: Sideways
Author

Anil Panchal
FXStreet
Anil Panchal has nearly 15 years of experience in tracking financial markets. With a keen interest in macroeconomics, Anil aptly tracks global news/updates and stays well-informed about the global financial moves and their implications.


