GBP/JPY Technical Analysis: Choppy between 21-day EMA, monthly trendline
- GBP/JPY has been range-bound since mid-October.
- A gradually declining RSI reflects the price weakness from 141.50.
- 23.6% Fibonacci retracement, 200-day EMA could come back on the chart on the downside break.

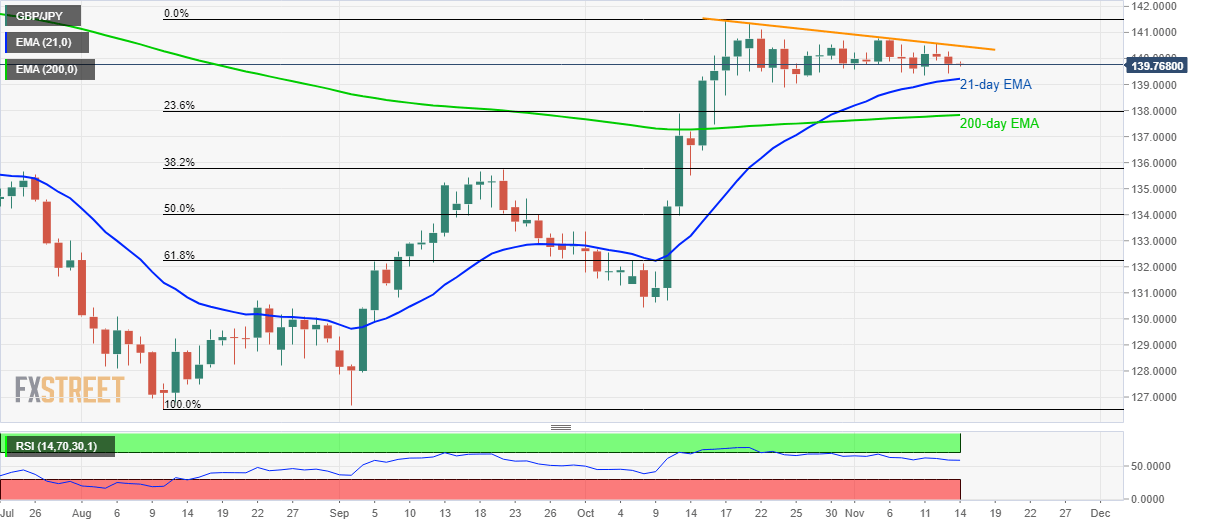
While carrying forward its near-term trading range between 21-day EMA and a four-week-old falling trend line, the GBP/JPY pair trades around 139.77 amid the initial Thursday.
However, gradually declining levels of 14-day Relative Strength Index (RSI), coupled with the recent weakness in prices, signal pair’s declines to 138.00/137.80 confluence including 23.6% Fibonacci retracement of August-September upside and 200-day Exponential Moving Average (EMA) should the quote drop below 21-day EMA level of 139.22.
If at all bears keep dominating past-137.80, 38.2% Fibonacci retracement and September month high could please sellers around 135.75.
Meanwhile, pair’s break of monthly trend line resistance, at 140.50 now, can trigger fresh run-up to October month high near 141.50.
During the pair’s further rise past-141.50, late-May top close to 141.75 will be on the bulls’ radars.
GBP/JPY daily chart
Trend: Sideways
Author

Anil Panchal
FXStreet
Anil Panchal has nearly 15 years of experience in tracking financial markets. With a keen interest in macroeconomics, Anil aptly tracks global news/updates and stays well-informed about the global financial moves and their implications.


