GBP/JPY technical analysis: Aims for immediate resistance-line, 61.8% Fibo. inside rising-wedge
- Sustained trading beyond 38.2% Fibonacci retracement, RSI recovery signals GBP/JPY rise.
- 5-day long resistance-line, 61.8% Fibonacci retracement act as nearby upside barrier.
- Rising wedge confirmation should be awaited for fresh shorts.

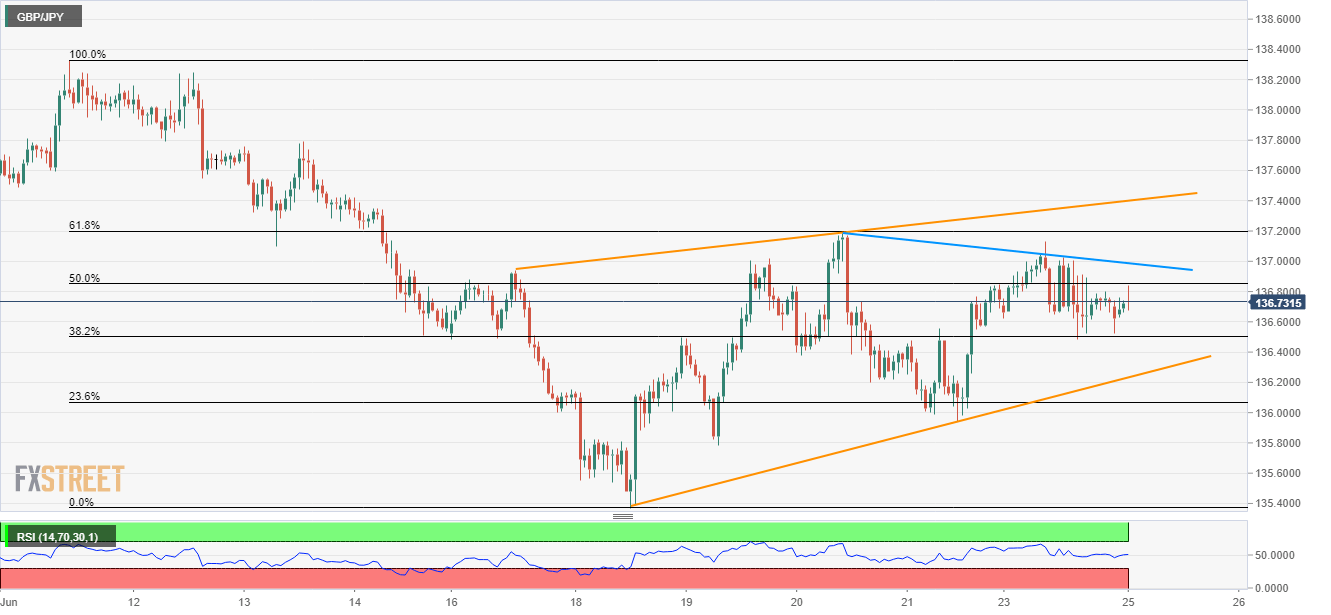
With its repeated upswings from 38.2% Fibonacci retracement of mid-June declines, the GBP/JPY pair again aims to confront nearby trend-line resistance as it trades near 136.76 during early Tuesday.
Adding to the odds of an up-move is gradually recovering 14-bar relative strength index (RSI).
Should the quote manage to clear 137.00 resistance-line, 61.8% Fibonacci retracement level around 137.20 and upper-line of a week-long rising wedge formation, near 137.40, can return to the chart.
Though, pair’s sustained trading beyond 137.40 might not refrain from challenging 137.80 and the current month high around 138.33.
Alternatively, 136.50 comprising 38.2% Fibonacci retracement may offer adjacent support to the pair ahead of dragging it to the technical pattern support level of 136.23.
In a case where prices slip under 136.23, a bearish formation gets confirmed that in turn offers a fresh down leg to 135.80 and 135.40.
GBP/JPY hourly chart
Trend: Bullish
Author

Anil Panchal
FXStreet
Anil Panchal has nearly 15 years of experience in tracking financial markets. With a keen interest in macroeconomics, Anil aptly tracks global news/updates and stays well-informed about the global financial moves and their implications.


