|

GBP/JPY sees additional losses for Friday, ends the week near recent lows at 181.60

  • The GBP/JPY extended losses into Friday trading, tapping into 181.27 and ending the week on the low side.
  • The Pound Sterling rose to 183.82 in the mid-week, but bad data buds and souring market sentiment sent the Guppy back into the week's lows.
  • Coming up next week: UK labor and wages figures on Tuesday, UK CPI on Wednesday.

The GBP/JPY chalked in another red bar to settle Friday, bringing the pair back into range of the week's lows set on Monday near 181.25, and the closing bell finds the Guppy trading into 181.60.

The pair spent the first half of the trading week on the climb, tapping into four-week highs at 183.82 before market turned broadly risk-off and sent the Pound Sterling (GBP) sharply lower against the Yen (JPY), sending the GBP/JPY down over 1% to end the trading week in the red, down about 60 pips.

UK economic indicators broadly came in red for Thursday, with Manufacturing Production for August declining 0.8%, down from the forecast -0.4% and seeing a mild rebound from the previous -1.2%, which was revised sharply down from -0.8%.

Coming up next week will be a quiet Monday on the Guppy's calendar, with Tuesday opening up with a speech from the Bank of England's (BoE) Huw Pill, followed by labor and wage data, with the UK's Employment Change for August forecast to moderate from -207K to -195K, and Average Earnings are expected to hold steady at 7.8% for the quarter into August.

After that will be the big read for the week on the Pound Sterling side with UK Consumer Price Index (CPI) inflation figures on Wednesday, and investors will be looking for CPI inflation for September to tick upwards slightly from 0.4% to 0.3% as inflation pressures continue to weigh on the United Kingdom.

GBP/JPY Technical Outlook

The GBP/JPY slipped below the 200-hour Simple Moving Average (SMA) in Friday's trading, declining from the day's early high of 182.94. 

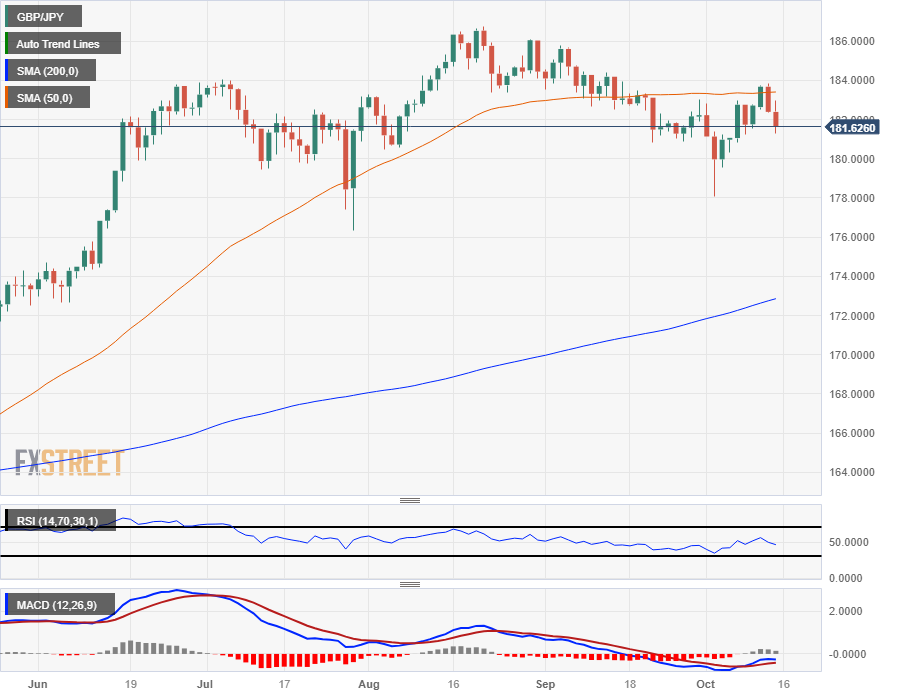
On the daily candlesticks the GBP/JPY remains well-bid, albeit with some bearish cracks starting to show; the 50-day SMA is capping off near-term price action from 183.40.

The 180.00 handle has been holding steady as a technical floor for the Guppy, but this week's turnaround from just south of 184.00 could see the GBP/JPY facing a bearish extension if bidders aren't able to scrape together enough confidence to pull the pair back up the charts.

GBP/JPY Daily Chart

GBP/JPY Technical Levels

GBP/JPY

Overview
Today last price181.63
Today Daily Change-0.76
Today Daily Change %-0.42
Today daily open182.39
 
Trends
Daily SMA20182.04
Daily SMA50183.39
Daily SMA100181.58
Daily SMA200172.75
 
Levels
Previous Daily High183.82
Previous Daily Low182.34
Previous Weekly High182.98
Previous Weekly Low178.08
Previous Monthly High185.78
Previous Monthly Low180.82
Daily Fibonacci 38.2%182.9
Daily Fibonacci 61.8%183.25
Daily Pivot Point S1181.88
Daily Pivot Point S2181.36
Daily Pivot Point S3180.39
Daily Pivot Point R1183.36
Daily Pivot Point R2184.34
Daily Pivot Point R3184.85

Author

Joshua Gibson

Joshua joins the FXStreet team as an Economics and Finance double major from Vancouver Island University with twelve years' experience as an independent trader focusing on technical analysis.

More from Joshua Gibson
Share:

Editor's Picks

AUD/USD falls to near 0.7100 after slipping below 50-day EMA

AUD/USD depreciates after registering minor gains in the previous day, trading around 0.7120 during the Asian hours. The technical analysis of the daily chart shows the pair consolidating sideways within a rectangle pattern, as neither bulls nor bears gain control. The AUD/USD pair is holding a slight bearish tone however as it sits beneath both the nine-day and 50-day EMAs.

160.00: USD/JPY back near intervention territory after upbeat US jobs report

US Nonfarm Payrolls beat expectations by a wide margin in May, with 172K jobs added. The US Dollar rebounds after the release, helping USD/JPY recover from its intraday lows. Warnings from Japanese authorities continue to limit upside potential near the 160.00 threshold.

Gold weakens to three-month lows near $4,300

Gold faces increasing selling interest and approaches the area of three-month lows near the $4,300 mark per troy ounce on Friday. The precious metal’s decline comes as traders assess the stronger-than-expected NFP, while the bid bias in the Greenback and higher US Treasury yields also collaborate with the retracement.

Cardano hits five-year low even as Hoskinson clarifies "break" isn't an exit

Cardano (ADA) price is down 10% at press time on Friday, extending losses over 30% so far this week amid Charles Hoskinson's clarification that "break" isn't an exit.

Week ahead – Fed countdown begins amid US inflation data and geopolitical risks

Fed Chair Warsh’s first meeting approaches as key US inflation data could reshape expectations. Oil prices remain elevated as US-Iran talks continue; tariffs also return to the spotlight. ECB is expected to hike; will it be a one-off move or is July live?

The US economy defies the rules: 100 days into the Oil shock and the recession signal is still missing

More than three months after the start of the Iran war and the resulting disruption to global energy markets, the US economy continues to display remarkable resilience. The conflict has triggered a sharp rise in Oil prices, reignited inflationary pressures and fueled widespread concerns about a potential economic slowdown.