|

GBP/JPY Price Prediction: Counter-trend rally stutters, risks giving way

  • GBP/JPY’s August rally is running out of steam and risks reversing lower. 
  • It has sold off steeply from the September peak and broken below a key level.
  • Further weakness is required to confirm a bearish reversal. 

GBP/JPY has unfolded a recovery rally since the August 5 lows. Since then, it has risen from a low of 180.09 to a peak of 193.49 reached on September 2. 

This almost month-long rally is now showing signs of weakness, however, which indicates the risk of a reversal lower is growing. If GBP/JPY does reverse lower, the bias will shift to favoring lower prices. 

GBP/JPY 4-hour Chart 

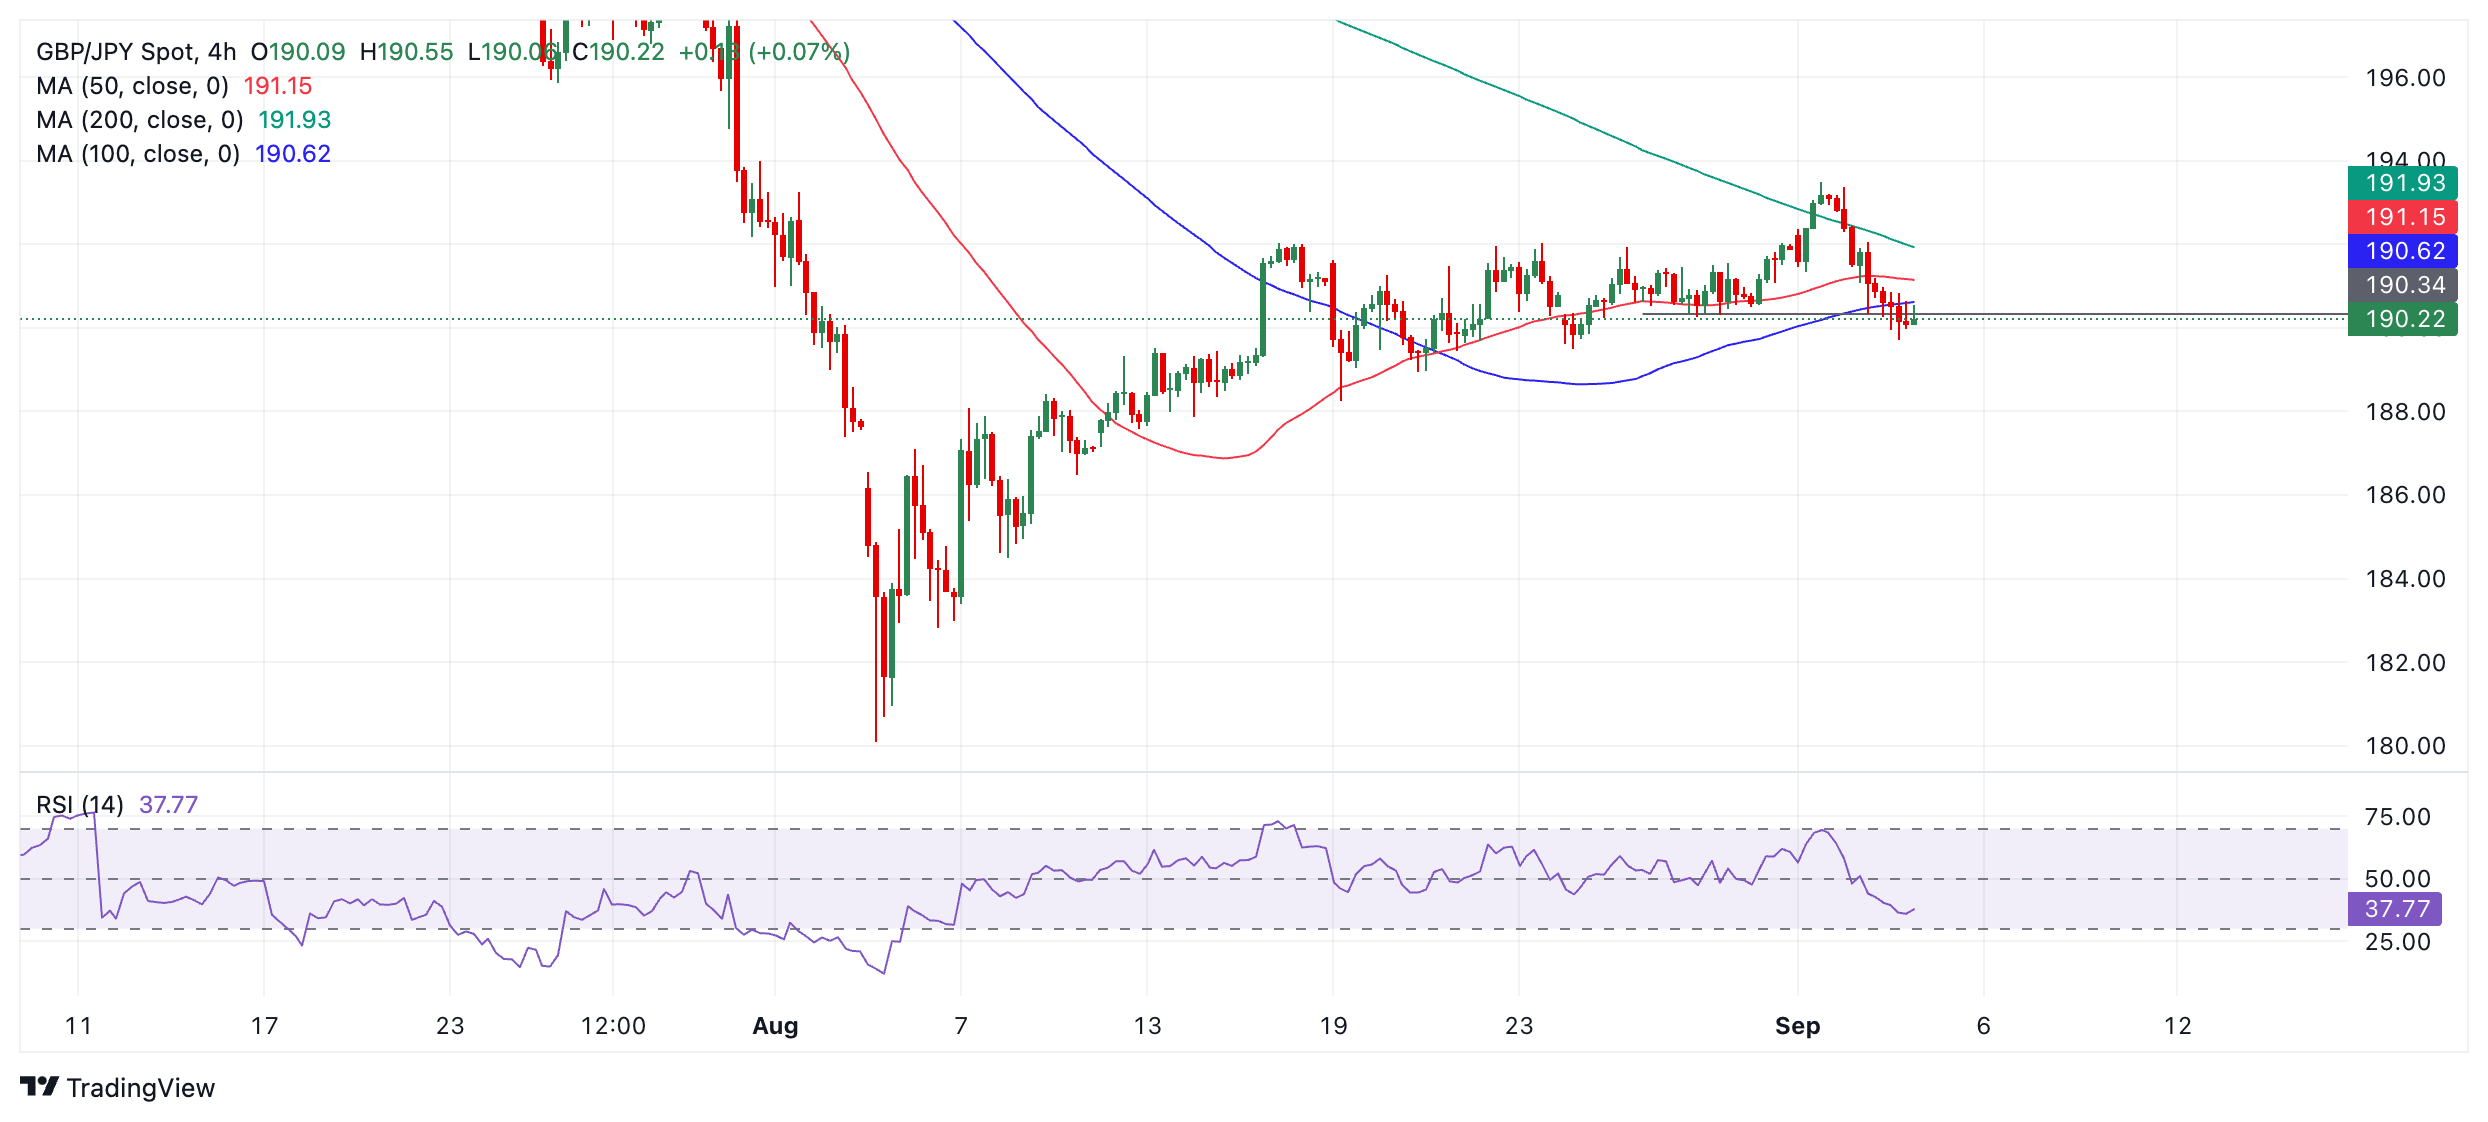
The pair has fallen quite steeply from the September 2 highs and it recently broke below a key swing low situated at around 190.26. 

The Relative Strength Index (RSI) momentum indicator has fallen to 37.77 and is showing the momentum that accompanied the sell-off from the peak was strong. 

Although these signs suggest a bearish reversal is developing, they are not quite enough to be confident. The pair needs to fall lower to be more certain. Ideally it should fall below 189.50 (August 26 low) to confirm a new bear trend was underway. Such a move would probably follow through down to an initial target at 188.24 (August 19 low). 

Alternatively, a recovery is still possible given the lack of downside confirmation. A close above 192.00 would strongly indicate a resumption of the August rally was underway. Such a move would then be expected to continue up to the 193.49 September 2 highs.

Author

Joaquin Monfort

Joaquin Monfort is a financial writer and analyst with over 10 years experience writing about financial markets and alt data. He holds a degree in Anthropology from London University and a Diploma in Technical analysis.

More from Joaquin Monfort
Share:

Editor's Picks

AUD/USD eyes 0.7150 barrier nine-day EMA

AUD/USD inches higher after registering modest losses in the previous day, trading around 0.7130 during the Asian hours. The technical analysis of the daily chart indicates that the pair is moving sideways within the rectangle pattern, suggesting a consolidation as neither the bulls nor the bears have enough momentum to take control of the market.

USD/JPY trades below 160.00 intervention threshold; bullish bias intact

The USD/JPY pair attracts some sellers during the Asian session amid fears that authorities will step in again to prop up the Japanese Yen. Furthermore, the Israel-Lebanon truce prompts some profit-taking around the US Dollar and exerts downward pressure on the currency pair.

Gold defends 200-day SMA at $4,425, but for how long?

Gold is attempting a tepid recovery toward $4,500 early Thursday, as renewed optimism in the Mideast geopolitical front calms market nerves. This cautious optimism across Asian markets weighs on Oil prices, and diminishes the US Dollar’s safe-haven appeal, helping Gold stage a decent comeback from the weekly low of $4,424.


Hyperliquid: ETF demand, capital rotation fuel HYPE rally as Bitcoin melts

Hyperliquid price sustains an upward trend near its all-time high of $75.76 on Thursday after posting 80% gains in May, while Bitcoin (BTC) retraces below $65,000, triggering a market-wide panic.

Kevin Warsh takes the Fed helm: What it means for the US Dollar
The Federal Reserve moves away from the highly predictable "forward guidance" model of the Jerome Powell era to a new “Kevin Warsh environment”, characterized by less communication, more policy surprises, and an increased focus on the Fed's complex balance sheet.
Recession on paper: What really moves the Canadian Loonie now?

Statistics Canada handed the headline writers a gift and the analysts a headache. Real GDP shrank 0.1% on an annualized basis in the first quarter, and with the fourth quarter of 2025 revised down to a 1.0% contraction, that is two negative quarters in a row, the textbook definition of a technical recession and Canada's first since the pandemic.