|

GBP/JPY Price Analysis: Treads water around 173.20s, but keeps its bullish bias

  • GBP/JPY remains unchanged mainly but sustains its bullish bias, ending Wednesday’s session at 173.30 after a dip to 172.51.
  • Candlestick patterns hint at a potential decline, pending confirmation with a close below the Tenkan-line.
  • The RSI and 3-day RoC suggest a sustained upward trend, highlighting critical levels for price shifts.

GBP/JPY ended Wednesday’s session almost flat after traveling from its daily low/high of 172.51-173.64. However, as the Asian session begins, the GBP/JPY floats around 173.24, unchanged but maintaining its bullish bias.

GBP/JPY Price Analysis: Technical outlook

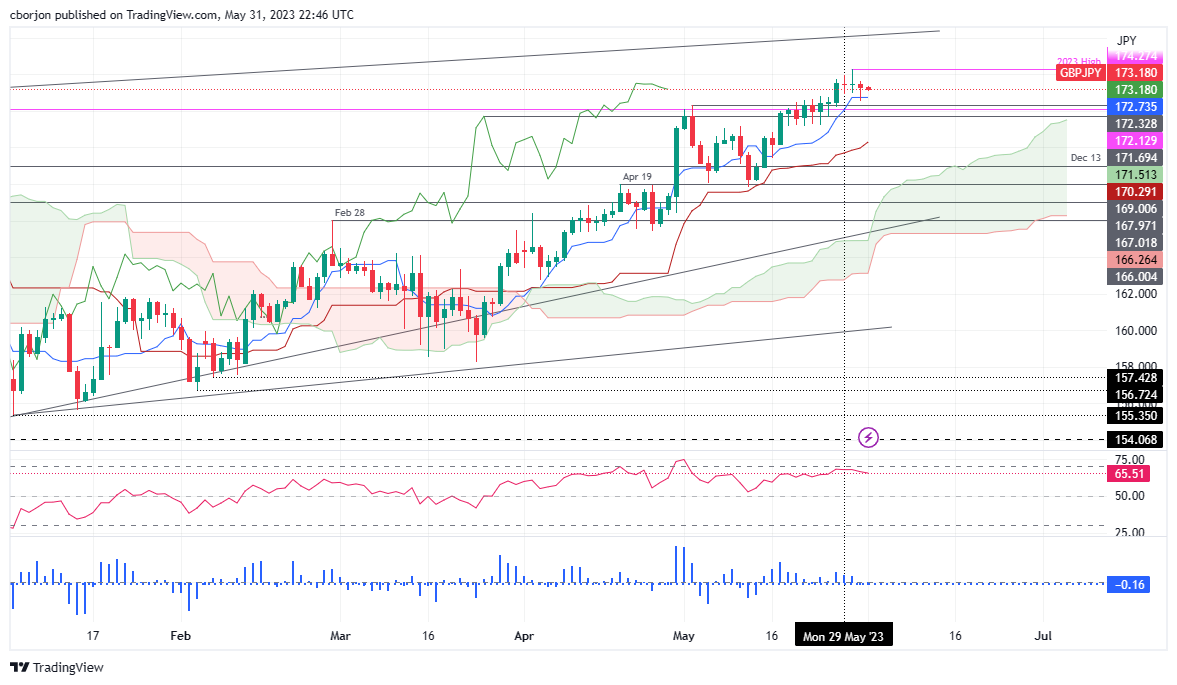
The GBP/JPY remains upward biased, per the daily chart, but it could have dipped lower. Thankfully, the Tenkan-Sen level at 172.73, which briefly pierced, opened the door for a GBP/JPY dip toward a new weekly low of 172.51 but acted as support as the GBP/JPY bounced off that price level, closing Wednesday’s session at 173.30.

During the last three days, the GBP/JPY candlestick chart portrays two dojis, followed by one hanging-man, suggesting further downside is expected. But, the GBP/JPY must achieve a daily close below the Tenkan-line. A breach of the latter will expose the May 2 daily high shifted support at 172.33 before reaching the Chikou-Span peak of March 27 at 171.69. Once cleared, the GBP/JPY can fall toward the Kijun-Sen at 170.29.

Conversely, for a GBP/JPY bullish continuation, the cross needs to conquer the 174.00 mark. Clearance of that level could pave the way to test the YTD high of 174.24 before opening the door to the 2016 high of 177.37.

Oscillators like the Relative Strength Index (RSI) indicator and the 3-day Rate of Change (RoC) warrant further upside expected. Therefore, the trend I set to continue upward.

GBP/JPY Price Action – Daily chart

GBP/JPY Daily chart

GBP/JPY

Overview
Today last price173.23
Today Daily Change-0.31
Today Daily Change %-0.18
Today daily open173.54
 
Trends
Daily SMA20171.15
Daily SMA50167.72
Daily SMA100164.32
Daily SMA200164.3
 
Levels
Previous Daily High174.28
Previous Daily Low172.99
Previous Weekly High173.74
Previous Weekly Low171.2
Previous Monthly High171.18
Previous Monthly Low162.78
Daily Fibonacci 38.2%173.79
Daily Fibonacci 61.8%173.48
Daily Pivot Point S1172.93
Daily Pivot Point S2172.32
Daily Pivot Point S3171.64
Daily Pivot Point R1174.22
Daily Pivot Point R2174.89
Daily Pivot Point R3175.5

Author

Christian Borjon Valencia

Christian Borjon began his career as a retail trader in 2010, mainly focused on technical analysis and strategies around it. He started as a swing trader, as he used to work in another industry unrelated to the financial markets.

More from Christian Borjon Valencia
Share:

Markets move fast. We move first.

Orange Juice Newsletter brings you expert driven insights - not headlines. Every day on your inbox.

By subscribing you agree to our Terms and conditions.

Editor's Picks

EUR/USD recovers to 1.1750 region as 2025 draws to a close

Following the bearish action seen in the European session on Wednesday, EUR/USD regains its traction and recovery to the 1.1750 region. Nevertheless, the pair's volatility remains low as trading conditions thin out on the last day of the year.

GBP/USD stays weak near 1.3450 on modest USD recovery

GBP/USD remains under modest beairsh pressure and fluctuates at around 1.3450 on Wednesday. The US Dollar finds fresh demand due to the end-of-the-year position adjustments, weighing on the pair amid the pre-New Year trading lull. 

Gold retreats to $4,300 area, looks to post monthly gains

Gold stays on the back foot on the last day of 2025 and trades near $4,300, possibly pressured by profit-taking and position adjustments. Nevertheless, XAU/USD remains on track to post gains for December and extend its winning streak into a fifth consecutive month.

Bitcoin, Ethereum and XRP prepare for a potential New Year rebound

Bitcoin, Ethereum, and Ripple are holding steady on Wednesday after recording minor gains on the previous day. Technically, Bitcoin could extend gains within a triangle pattern while Ethereum and Ripple face critical overhead resistance. 

Economic outlook 2026-2027 in advanced countries: Solidity test

After a year marked by global economic resilience and ending on a note of optimism, 2026 looks promising and could be a year of solid economic performance. In our baseline scenario, we expect most of the supportive factors at work in 2025 to continue to play a role in 2026.

Crypto market outlook for 2026

Year 2025 was volatile, as crypto often is.  Among positive catalysts were favourable regulatory changes in the U.S., rise of Digital Asset Treasuries (DAT), adoption of AI and tokenization of Real-World-Assets (RWA).