- GBP/JPY faced rejection near 200-DMA and for now, seems to have stalled the recent bullish move.
- The technical set-up warrants some caution before positioning for any near-term corrective slide.
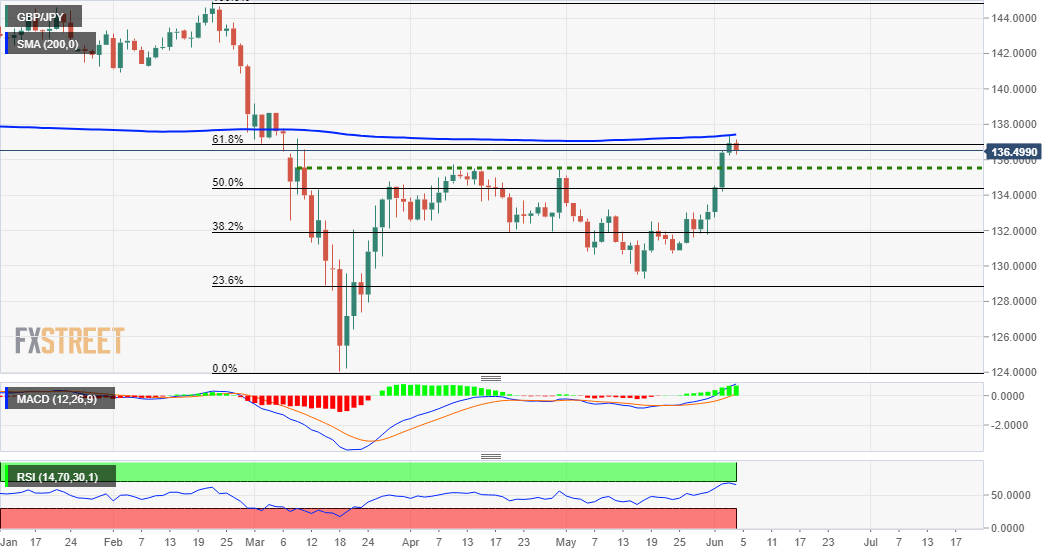
The GBP/JPY bulls struggled to capitalize on the recent upward trajectory and faced rejection near the very important 200-day SMA. The cross also failed to find acceptance above the 61.8% Fibonacci level of the 144.96-124.07 downfall.
A subsequent fall through the early European session on Thursday suggests that the bullish momentum might have already run out of the steam. However, daily RSI maintained its bullish bias and has already eased from overbought conditions.
Despite the emergence of some fresh selling pressure, it will be prudent to wait for some follow-through selling before confirming that the cross might have already topped out in the near-term and positioning for any further depreciating move.
Meanwhile, immediate support is pegged near the 136.00 mark, below which the cross could slide further towards the 135.50-40 resistance breakpoint. Failure to defend the mentioned resistance-turned-support might be seen as a fresh trigger for bearish trades.
On the flip side, the 61.8% Fibo. level, around the 137.00 round-figure mark, now seems to act as immediate resistance. This is followed by the 200-DMA near the 137.40 region, which if cleared will set the stage for an extension of the recent move up.
GBP/JPY daily chart
Technical levels to watch
Information on these pages contains forward-looking statements that involve risks and uncertainties. Markets and instruments profiled on this page are for informational purposes only and should not in any way come across as a recommendation to buy or sell in these assets. You should do your own thorough research before making any investment decisions. FXStreet does not in any way guarantee that this information is free from mistakes, errors, or material misstatements. It also does not guarantee that this information is of a timely nature. Investing in Open Markets involves a great deal of risk, including the loss of all or a portion of your investment, as well as emotional distress. All risks, losses and costs associated with investing, including total loss of principal, are your responsibility. The views and opinions expressed in this article are those of the authors and do not necessarily reflect the official policy or position of FXStreet nor its advertisers. The author will not be held responsible for information that is found at the end of links posted on this page.
If not otherwise explicitly mentioned in the body of the article, at the time of writing, the author has no position in any stock mentioned in this article and no business relationship with any company mentioned. The author has not received compensation for writing this article, other than from FXStreet.
FXStreet and the author do not provide personalized recommendations. The author makes no representations as to the accuracy, completeness, or suitability of this information. FXStreet and the author will not be liable for any errors, omissions or any losses, injuries or damages arising from this information and its display or use. Errors and omissions excepted.
The author and FXStreet are not registered investment advisors and nothing in this article is intended to be investment advice.
Recommended content
Editors’ Picks

GBP/USD rises above 1.3300 after UK Retail Sales data
GBP/USD trades with a positive bias for the third straight day on Friday and hovers above the 1.3300 mark in the European morning on Friday. The data from the UK showed that Retail Sales rose at a stronger pace than expected in August, supporting Pound Sterling.

USD/JPY recovers to 142.50 area during BoJ Governor Ueda's presser
USD/JPY stages a modest recovery toward 142.50 in the European morning following the initial pullback seen after the BoJ's decision to maintain status quo. In the post-meeting press conference, Governor Ueda reiterated that they will adjust the degree of easing if needed.

Gold consolidates weekly gains, with sight on $2,600 and beyond
Gold price is looking to build on the previous day’s rebound early Friday, consolidating weekly gains amid the overnight weakness in the US Dollar alongside the US Treasury bond yields. Traders now await the speeches from US Federal Reserve monetary policymakers for fresh hints on the central bank’s path forward on interest rates.

Shiba Inu is poised for a rally as price action and on-chain metrics signal bullish momentum
Shiba Inu remains strong on Friday after breaking above a symmetrical triangle pattern on Thursday. This breakout signals bullish momentum, further bolstered by a rise in daily new transactions that suggests a potential rally in the coming days.

Bank of Japan set to keep rates on hold after July’s hike shocked markets
The Bank of Japan is expected to keep its short-term interest rate target between 0.15% and 0.25% on Friday, following the conclusion of its two-day monetary policy review. The decision is set to be announced during the early Asian session.

Moneta Markets review 2024: All you need to know
VERIFIED In this review, the FXStreet team provides an independent and thorough analysis based on direct testing and real experiences with Moneta Markets – an excellent broker for novice to intermediate forex traders who want to broaden their knowledge base.