- GBP/JPY takes the bids near a one-week high.
- 50% Fibonacci retracement, eight-day-old ascending channel’s resistance will question the bulls.
- The sub-141.00 area could please the sellers on the downside break of the said channel.
GBP/JPY rises to 143.50, the highest since January 10, by the press time of early hours of Thursday’s Asian session. The pair follows an eight-day rising channel formation on the four-hour chart, which together with normal RSI conditions, favor its further recovery.
In doing so, 50% Fibonacci retracement of the quote’s declines from December 13 to 25, around 144.15, can become the immediate resistance ahead of the channel’s upper line around 144.70.
Also supporting the pair's recent upside could be the Brexit positive news that came from German Chancellor Angela Merkel, who warned the European Union (EU) that Brexit is a wake up call. The same could help the regional leaders to soften their stand while discussing future trade deals with the US.
It should, however, be noted that the quote’s rise past-144.70 needs to be backed by the sustained break of 145.00 round-figure, also comprising 61.8% of Fibonacci retracement.
Meanwhile, sellers will look for entry below the aforementioned channel’s support-line, at 142.75 now.
The sustained downside below 142.75 may catch a breath near 23.6% Fibonacci retracement level of 142.00 ahead of targeting January 05 bottom, near 140.90 and the monthly trough surrounding 140.30.
GBP/JPY four hour chart
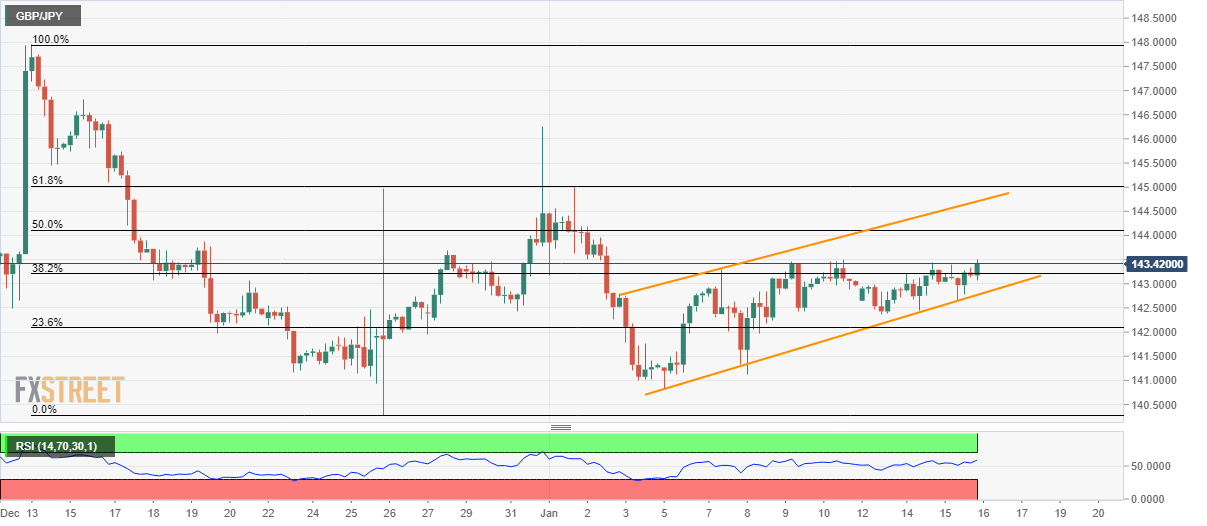
Trend: Bullish
Information on these pages contains forward-looking statements that involve risks and uncertainties. Markets and instruments profiled on this page are for informational purposes only and should not in any way come across as a recommendation to buy or sell in these assets. You should do your own thorough research before making any investment decisions. FXStreet does not in any way guarantee that this information is free from mistakes, errors, or material misstatements. It also does not guarantee that this information is of a timely nature. Investing in Open Markets involves a great deal of risk, including the loss of all or a portion of your investment, as well as emotional distress. All risks, losses and costs associated with investing, including total loss of principal, are your responsibility. The views and opinions expressed in this article are those of the authors and do not necessarily reflect the official policy or position of FXStreet nor its advertisers. The author will not be held responsible for information that is found at the end of links posted on this page.
If not otherwise explicitly mentioned in the body of the article, at the time of writing, the author has no position in any stock mentioned in this article and no business relationship with any company mentioned. The author has not received compensation for writing this article, other than from FXStreet.
FXStreet and the author do not provide personalized recommendations. The author makes no representations as to the accuracy, completeness, or suitability of this information. FXStreet and the author will not be liable for any errors, omissions or any losses, injuries or damages arising from this information and its display or use. Errors and omissions excepted.
The author and FXStreet are not registered investment advisors and nothing in this article is intended to be investment advice.
Recommended content
Editors’ Picks
EUR/USD edges lower toward 1.0700 post-US PCE

EUR/USD stays under modest bearish pressure but manages to hold above 1.0700 in the American session on Friday. The US Dollar (USD) gathers strength against its rivals after the stronger-than-forecast PCE inflation data, not allowing the pair to gain traction.
GBP/USD retreats to 1.2500 on renewed USD strength

GBP/USD lost its traction and turned negative on the day near 1.2500. Following the stronger-than-expected PCE inflation readings from the US, the USD stays resilient and makes it difficult for the pair to gather recovery momentum.
Gold struggles to hold above $2,350 following US inflation

Gold turned south and declined toward $2,340, erasing a large portion of its daily gains, as the USD benefited from PCE inflation data. The benchmark 10-year US yield, however, stays in negative territory and helps XAU/USD limit its losses.
Bitcoin Weekly Forecast: BTC’s next breakout could propel it to $80,000 Premium

Bitcoin’s recent price consolidation could be nearing its end as technical indicators and on-chain metrics suggest a potential upward breakout. However, this move would not be straightforward and could punish impatient investors.
Week ahead – Hawkish risk as Fed and NFP on tap, Eurozone data eyed too

Fed meets on Wednesday as US inflation stays elevated. Will Friday’s jobs report bring relief or more angst for the markets? Eurozone flash GDP and CPI numbers in focus for the Euro.