|

GBP/JPY Price Analysis: Dip buyers emerge at the 20-hour EMA as traders eye 166.00

  • GBP/JPY registers minimal losses as the Asian session begins, down 0.08%.
  • The cross-currency pair needs to break above 166.00 to open the door for upward prices.
  • Deterioration in traders’ mood and failures to crack 166.00 could send the GBP/JPY tumbling towards 163.00.

The GBP/JPY registers minimal losses as the Asian Pacific session begins. On Tuesday, the GBP/JPY opened below the 164.00 figure and rose towards the daily high at 165.54 before retracing some of its gains, finishing Tuesday’s trading session positive by 1%. At the time of writing, the GBP/JPY is trading at 165.24.

GBP/JPY Price Analysis: Technical outlook

Even though the cross-currency pair printed six days of gains, the GBP/JPY needs to clear September’s high at 167.94 to cement its upward bias. GBP/JPY traders should be aware that the Relative Strength Index (RSI) shifted from aiming upwards to flat, suggesting buyers’ exhaustion. Therefore, as buyers get a respite, the GBP/JPY might correct lower to challenge the YTD high at 168.73.

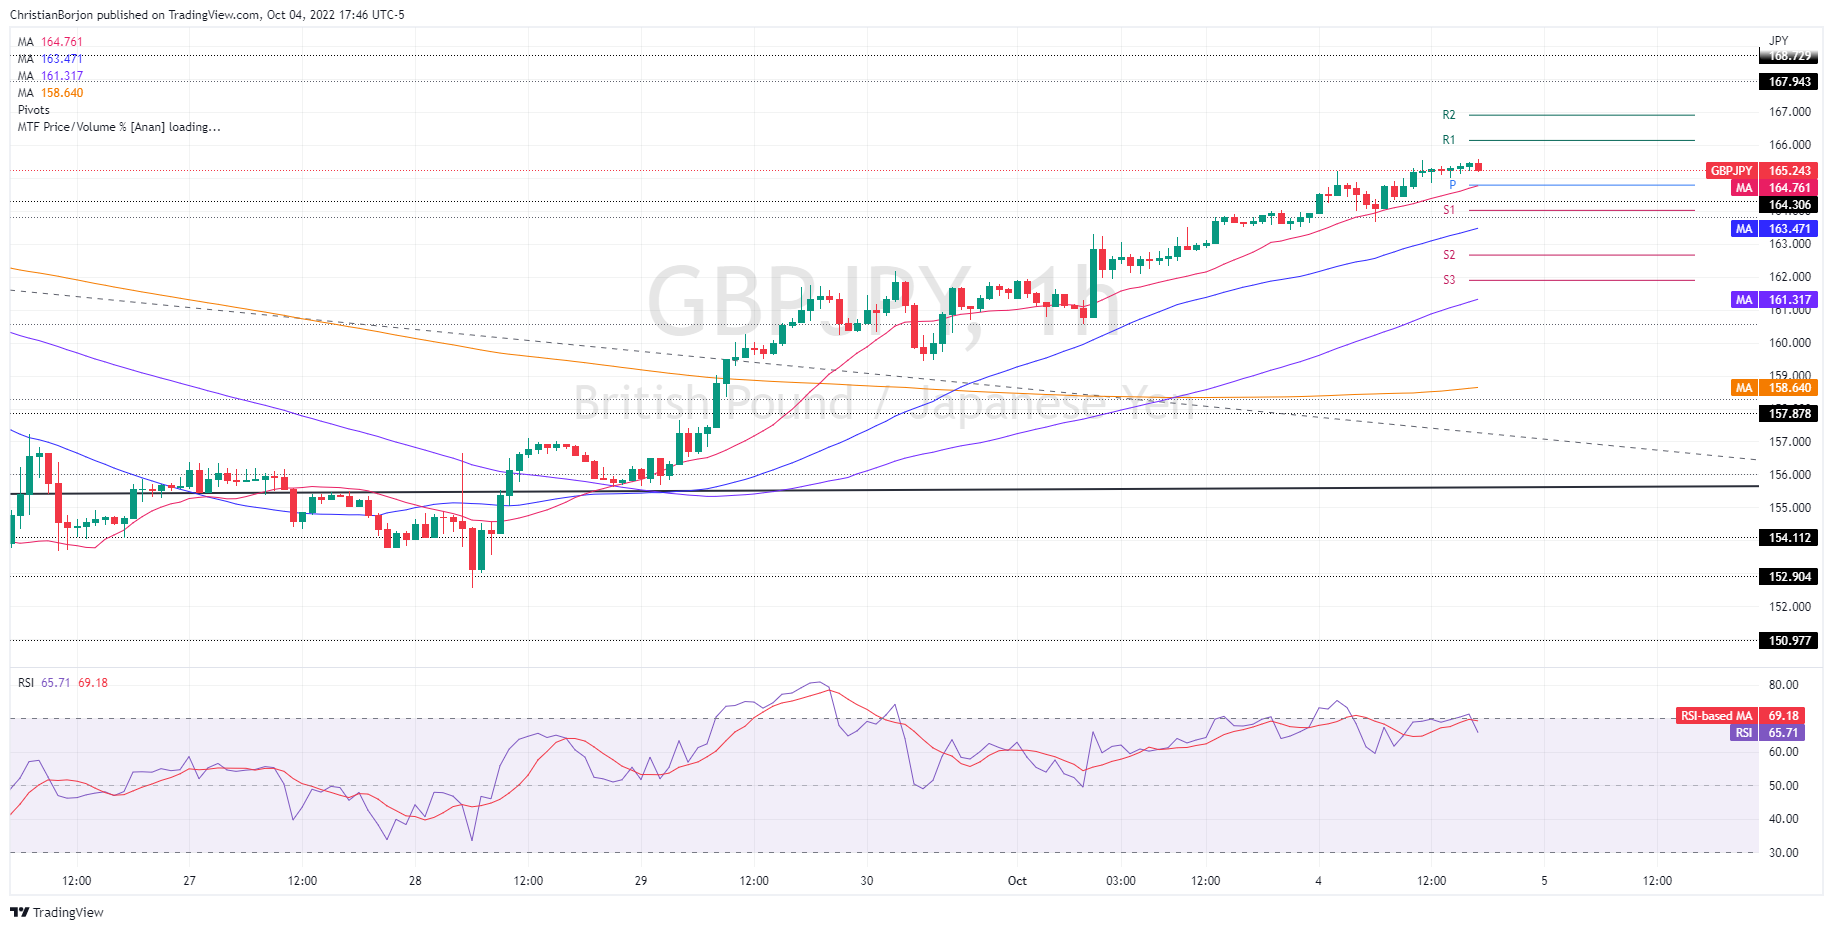
Short term, the GBP/JPY one-hour chart delineates prices advancing steadily, with the 20-hour EMA, as dynamic support, previously tested four times. Still, the GBP/JPY managed to stay on the bullish side of the moving average (MA), used for dip buyers to re-enter longs.

If the GBP/JPY is going to extend its gains, the first resistance would be 166.00. Once cleared, the next resistance would be the R1 daily pivot at 166.14, followed by the R2 pivot point at 167.00.

GBP/JPY’s failure to decisively break 166.00 and deterioration in sentiment could pave the way for further losses. Therefore, the first support would be the confluence of the daily pivot point and the 20-hour EMA at 165.26. Break below will expose the S1 pivot at 164.02, followed by the 50-hour EMA at 163.47 and the 163.00 mark.

GBP/JPY Key Technical Levels

GBP/JPY

Overview
Today last price165.26
Today Daily Change1.58
Today Daily Change %0.97
Today daily open163.68
 
Trends
Daily SMA20162.29
Daily SMA50162.3
Daily SMA100162.99
Daily SMA200160.5
 
Levels
Previous Daily High163.9
Previous Daily Low160.58
Previous Weekly High162.18
Previous Weekly Low148.8
Previous Monthly High167.22
Previous Monthly Low148.8
Daily Fibonacci 38.2%162.63
Daily Fibonacci 61.8%161.85
Daily Pivot Point S1161.54
Daily Pivot Point S2159.4
Daily Pivot Point S3158.23
Daily Pivot Point R1164.85
Daily Pivot Point R2166.03
Daily Pivot Point R3168.17

Author

Christian Borjon Valencia

Markets analyst, news editor, and trading instructor with over 14 years of experience across FX, commodities, US equity indices, and global macro markets.

More from Christian Borjon Valencia
Share:

Editor's Picks

EUR/USD eyes nine-day EMA barrier after rebounding from 1.1600

EUR/USD gains ground after registering modest losses in the previous session, trading around 1.1620 during the Asian hours on Friday. The technical analysis of the daily chart suggests an ongoing bearish bias as the pair remains within the descending channel pattern.

GBP/USD: Pound Sterling ticks up against US Dollar in countdown to US NFP

The Pound Sterling trades marginally higher to near 1.3365 against the US Dollar during the Asian trading session on Friday. The GBP/USD pair edges up as the US Dollar ticks down ahead of the United States Nonfarm Payrolls data for February, which will be published at 13:30 GMT.

Gold advances on increased safe-haven demand

Gold price recovers its recent losses from the previous session. The yellow metal advances as the broader precious metals market rebounds on safe-haven demand. However, the yellow metal is on track for its first weekly decline in five weeks as escalating Middle East tensions push oil prices higher, fueling inflation concerns and reducing bets on Federal Reserve rate cuts.

Bitcoin, Ethereum and Ripple at risk as US-Iran war extends

Bitcoin, Ethereum, and Ripple trade cautiously at press time on Friday, close to key support levels after a roughly 2% pullback the previous day. Bitcoin holds above $71,000, Ethereum at $2,000, and XRP continues to consolidate in a sideways range.

The market compass is pointing at a barrel of Oil

The Asian open is arriving with equities leaning the wrong way, and the reason is not complicated. The market’s compass needle has snapped firmly toward crude. In this tape, oil is not just another input price; it is the gravitational center around which every asset class is orbiting.

Top 3 Price Prediction: Bitcoin, Ethereum, Ripple at risk as US-Iran war extends

Bitcoin, Ethereum, and Ripple trade cautiously at press time on Friday, close to key support levels after a roughly 2% pullback the previous day. Bitcoin holds above $71,000, Ethereum at $2,000, and XRP continues to consolidate in a sideways range.