|

GBP/JPY Price Analysis: Bears slow down near 50% Fibonacci retracement amid oversold RSI

  • GBP/JPY stays heavy for fourth consecutive day, nears lowest levels since July 01.
  • The key Fibonacci retracement may offer intermediate moves but buyers are less likely to enter below 100-day SMA.
  • June low is on the bears’ radars below the immediate stop beyond 133.00.

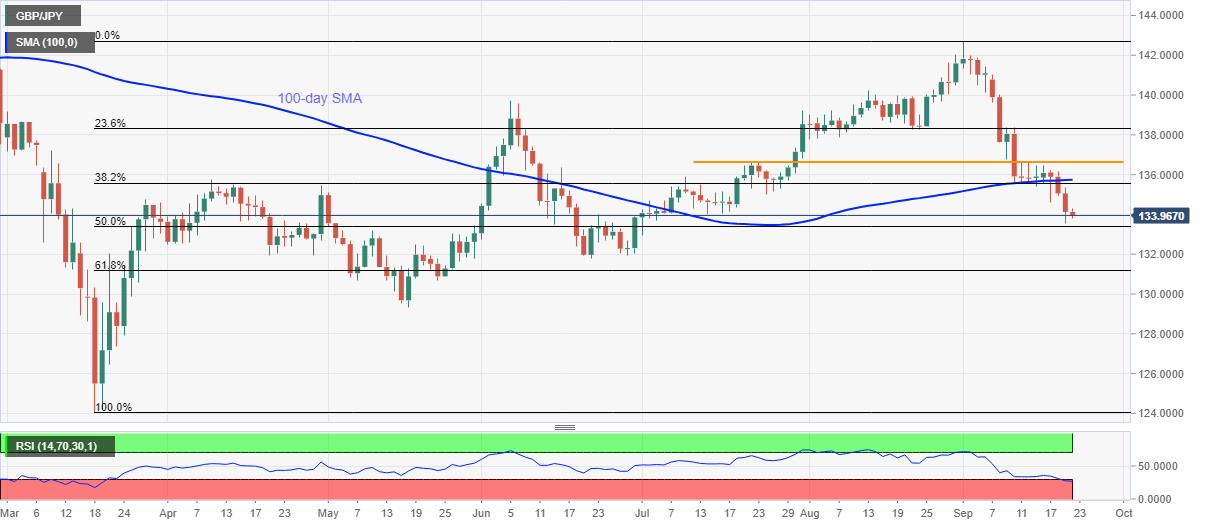
GBP/JPY stays mildly offered while declining to 133.98 during the pre-UK opening on Tuesday. In doing so, the pair sellers catch a breather around the lowest since early July amid the oversold RSI conditions.

Other than the aforementioned momentum indicator, the 50% Fibonacci retracement of March-September upside by GBP/JPY also probes the bears around 133.35.

As a result, the quote’s further weakness is limited beyond the key Fibonacci retracement support, a break of which will recall June month’s low of 131.76 back to the chart.

On the contrary, July 24 low near 135 may restrict the pair’s short-term pullback. Though, any buyers are likely to remain cautious unless witnessing a break of 100-day SMA, at 135.73 now.

Given the pair’s ability to cross 100-day SMA on a daily closing, multiple upside barriers around 136.60/65 can question the GBP/JPY buyers as portrayed by a short-term horizontal line.

GBP/JPY daily chart

Trend: Bearish

Additional important levels

Overview
Today last price133.96
Today Daily Change-0.17
Today Daily Change %-0.13%
Today daily open134.13
 
Trends
Daily SMA20138.44
Daily SMA50137.87
Daily SMA100135.72
Daily SMA200137.09
 
Levels
Previous Daily High135.34
Previous Daily Low133.54
Previous Weekly High136.59
Previous Weekly Low134.58
Previous Monthly High142.04
Previous Monthly Low137.75
Daily Fibonacci 38.2%134.23
Daily Fibonacci 61.8%134.65
Daily Pivot Point S1133.33
Daily Pivot Point S2132.54
Daily Pivot Point S3131.54
Daily Pivot Point R1135.13
Daily Pivot Point R2136.13
Daily Pivot Point R3136.92

Author

Anil Panchal

Anil Panchal

FXStreet

Anil Panchal has nearly 15 years of experience in tracking financial markets. With a keen interest in macroeconomics, Anil aptly tracks global news/updates and stays well-informed about the global financial moves and their implications.

More from Anil Panchal
Share:

Editor's Picks

EUR/USD seems fragile below 1.1700 as Middle East war boosts energy prices

The EUR/USD pair trades flat at around 1.1680 during the Asian trading session on Tuesday, but broadly seems vulnerable, being close to its five-week low. The major currency pair is under pressure as surging oil prices due to the United States-Israel war with Iran have increased the risks of higher inflation for the Old Continent.

GBP/USD hovers around 1.3400 with bearish pressure intact

GBP/USD edges higher after three days of losses, trading around 1.3400 during the Asian hours on Tuesday. The technical analysis of the daily chart indicates an ongoing bearish bias, as the pair trades within a descending channel pattern.

Gold stays bullish as Iran war continues to spur safe-haven flows

Gold is finding renewed bids in Asian trades on Tuesday, making another attempt to regain the $5,400 level amid persistent demand for safe-haven assets as the Iran war extends. A softer risk tone remains in play as US President Donald Trump continues to threaten deeper escalation to the ongoing war with Iran, warning that a “big wave” is yet to come.

Top Crypto Gainers: Near Protocol, Virtuals Protocol, and Morpho lead market recovery

Near Protocol, Virtuals Protocol, and Morpho are leading the market recovery with double-digit gains over the last 24 hours. Technically, NEAR extends the breakout of the falling channel pattern, VIRTUAL holds above the 50-day EMA, while MORPHO tests a crucial resistance. 

The market is not panicking it is repricing the probability distribution of Oil and time

At the end of the day, markets do not trade morality or geopolitics. They trade transmission channels. And the only channel that truly matters in this maelstrom runs through the price of energy and the time value of money.

Grass 20% bullish breakout defies broader market weakness

Grass (GRASS) is edging up above $0.30 at the time of writing on Monday. The token’s notable 20% intraday surge stands out amid heightened volatility in the broader crypto market.