GBP/JPY plunges below 201.00 as Yen recovery continues
- GBP/JPY followed other Yen pairs lower on Tuesday.
- The Yen is extending a near-term recovery after successive “Yenterventions”.
- Key UK and Japanese economic data due in the back half of the trading week.

GBP/JPY extended into further losses on Tuesday as the Japanese Yen continues a broad-base recovery sparked by a series of “Yenterventions” by the Bank of Japan (BoJ) and Japan’s Ministry of Finance (MoF) to try and prop up the beleaguered Yen. The synthesized Japanese Yen Index (JXY), a basket measure of the Yen’s overall performance against the other major global currencies, has fallen 12.62% peak-to-trough in 2024, and is down a staggering 37.51% since a peak in late 2020.
Guppy traders have eased off of the buy button in the face of increasingly-expensive direct market interventions on behalf of the Yen, but looming key datasets for both the UK and Japan could easily spark fresh moves in either direction. UK S&P Global/CIPS Purchasing Managers Index (PMI) activity figures are due Wednesday, with Japanese Tokyo Consumer Price Index (CPI) inflation figures slated for early Friday.
Markets are expecting a rebound in UK Services PMI figures, forecasting a print of 52.5 in July after easing to a seven-month low of 52.1 in June. On the Japanese data side, Friday’s core Tokyo CPI inflation is expected to tick upward to 2.2% for the year ended in July versus the previous period’s 2.1% YoY. Even if Tokyo CPI inflation rises to meet market expectations, the figure is unlikely to spark any moves from the BoJ on interest rates, which could see the Yen resuming a broad-market decline without further massive cash injections from the MoF.
GBP/JPY technical outlook
GBP/JPY tumbled below the 201.00 handle on Tuesday, testing into 200.80 as the pair extends a backslide from last week’s 16-year peak just north of 208.00. The pair has slipped below the 50-day Exponential Moving Average (EMA) at 201.50, but even a sustained bearish drop will have plenty of ground to cover before reaching the 200-day EMA far below at 192.52.
July is on pace to snap a six-month winning streak for the Guppy that saw the pair rise nearly 16.5% bottom-to-top. However, Yen bulls will still have their work cut out for them as the pair remains buried deep in bull country.
GBP/JPY hourly chart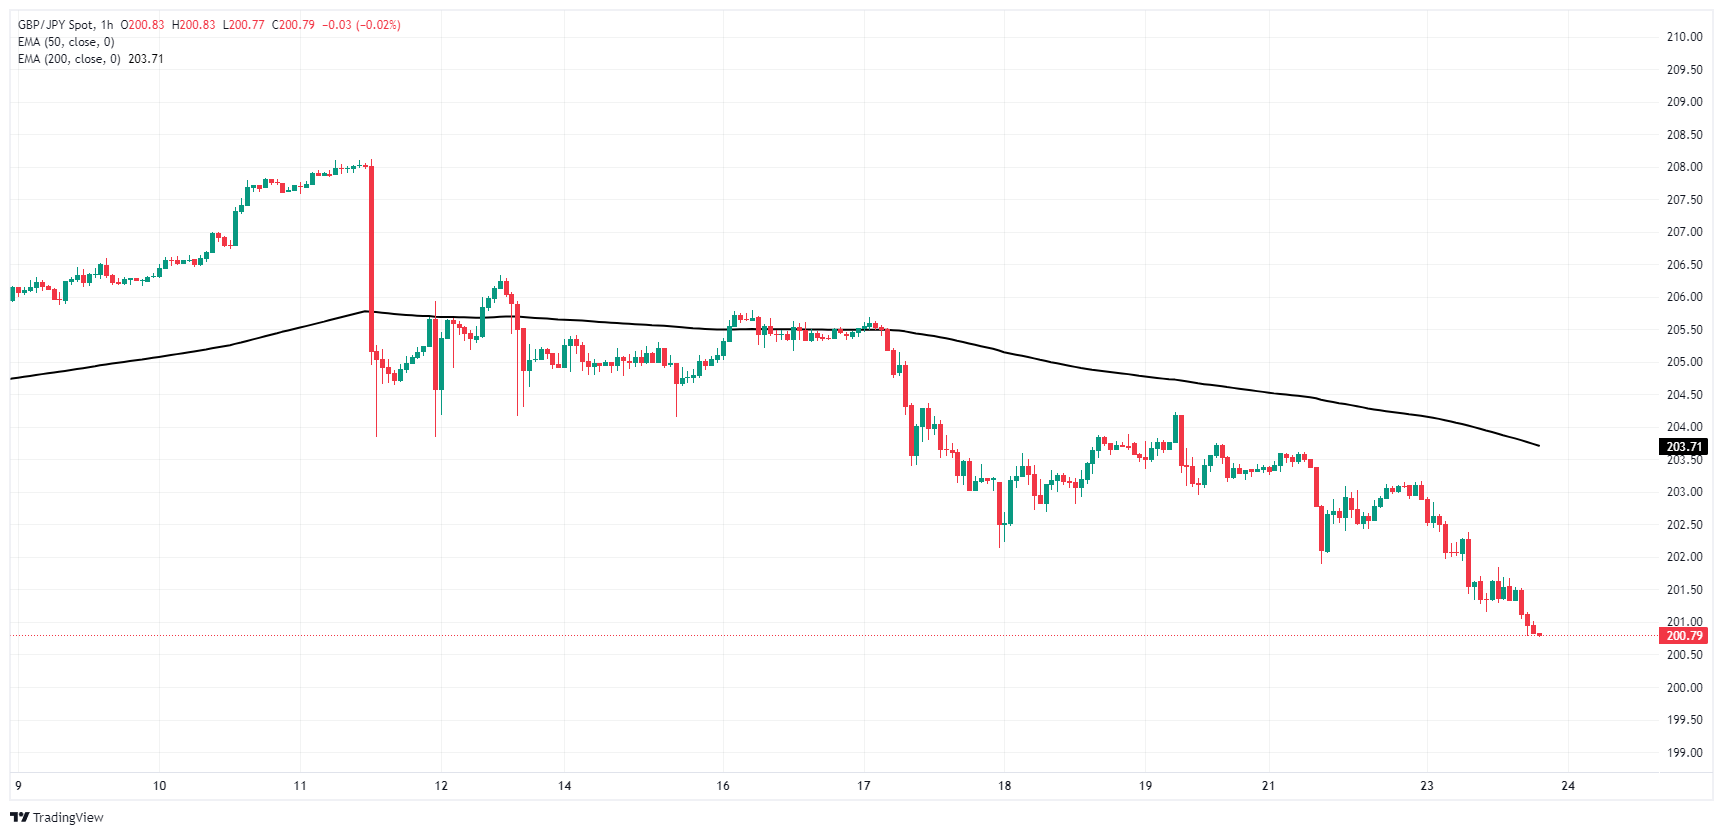
GBP/JPY daily chart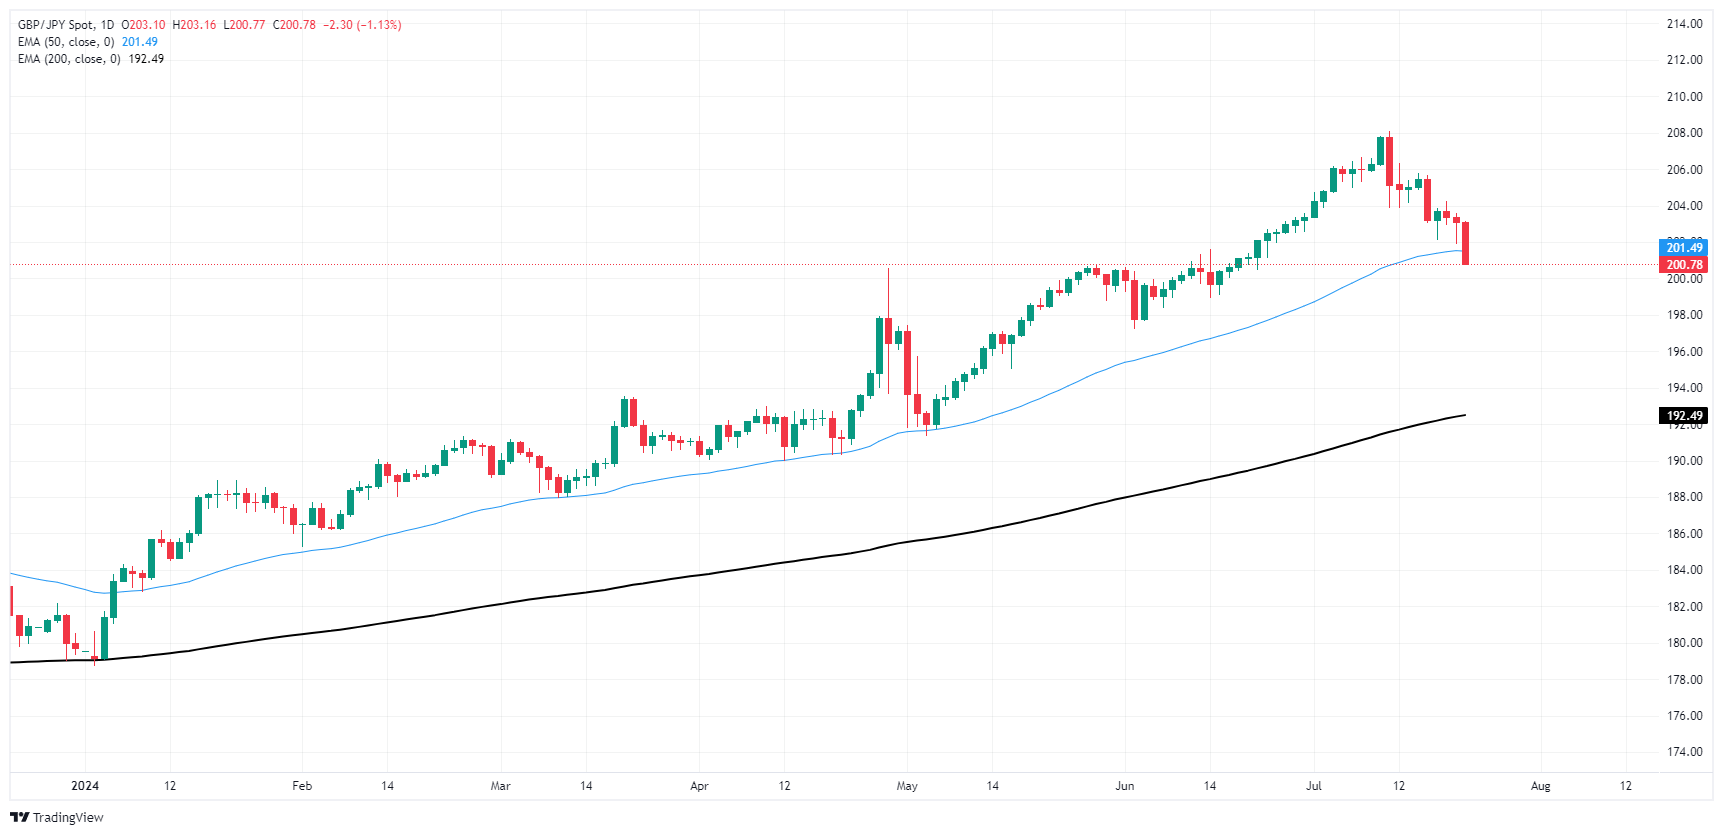
Japanese Yen FAQs
The Japanese Yen (JPY) is one of the world’s most traded currencies. Its value is broadly determined by the performance of the Japanese economy, but more specifically by the Bank of Japan’s policy, the differential between Japanese and US bond yields, or risk sentiment among traders, among other factors.
One of the Bank of Japan’s mandates is currency control, so its moves are key for the Yen. The BoJ has directly intervened in currency markets sometimes, generally to lower the value of the Yen, although it refrains from doing it often due to political concerns of its main trading partners. The current BoJ ultra-loose monetary policy, based on massive stimulus to the economy, has caused the Yen to depreciate against its main currency peers. This process has exacerbated more recently due to an increasing policy divergence between the Bank of Japan and other main central banks, which have opted to increase interest rates sharply to fight decades-high levels of inflation.
The BoJ’s stance of sticking to ultra-loose monetary policy has led to a widening policy divergence with other central banks, particularly with the US Federal Reserve. This supports a widening of the differential between the 10-year US and Japanese bonds, which favors the US Dollar against the Japanese Yen.
The Japanese Yen is often seen as a safe-haven investment. This means that in times of market stress, investors are more likely to put their money in the Japanese currency due to its supposed reliability and stability. Turbulent times are likely to strengthen the Yen’s value against other currencies seen as more risky to invest in.
Author

Joshua Gibson
FXStreet
Joshua joins the FXStreet team as an Economics and Finance double major from Vancouver Island University with twelve years' experience as an independent trader focusing on technical analysis.

















