|

GBP/JPY pierces 185.00 as Pound Sterling surges

  • The GBP/JPY is climbing on Friday, tipping into 2-month highs.
  • The Pound Sterling is lurching higher as market risk appetite returns.
  • GBP set for its best weekly performance in five months.

The GBP/JPY has pierced the 185.00 handle as the market heads into the final hours of the trading week, pushing into an 8-week high as broad market risk appetite finds a firm recovery.

The Japanese Yen (JPY) has been on the back foot after a dovish Bank of Japan (BoJ) recently ruined all of their own hard work in verbally defending the beleaguered JPY. 

The Pound Sterling (GBP) is catching a ride up the charts, pushing towards the front of the pack to come out in front as one of the winners on Friday, rebounding firmly against the Yen despite wavering in the mid-week after the Bank of England (BoE) held rates once more.

Economic data related to the GBP/JPY remains thin heading into next week, and GBP traders will be looking ahead to next Wednesday's appearance by BoE Governor Andrew Bailey, while Yen investors will want to keep an eye out for Japan's wage figures due early Tuesday, followed by JPY Trade Balance numbers on Wednesday.

GBP/JPY Technical Outlook

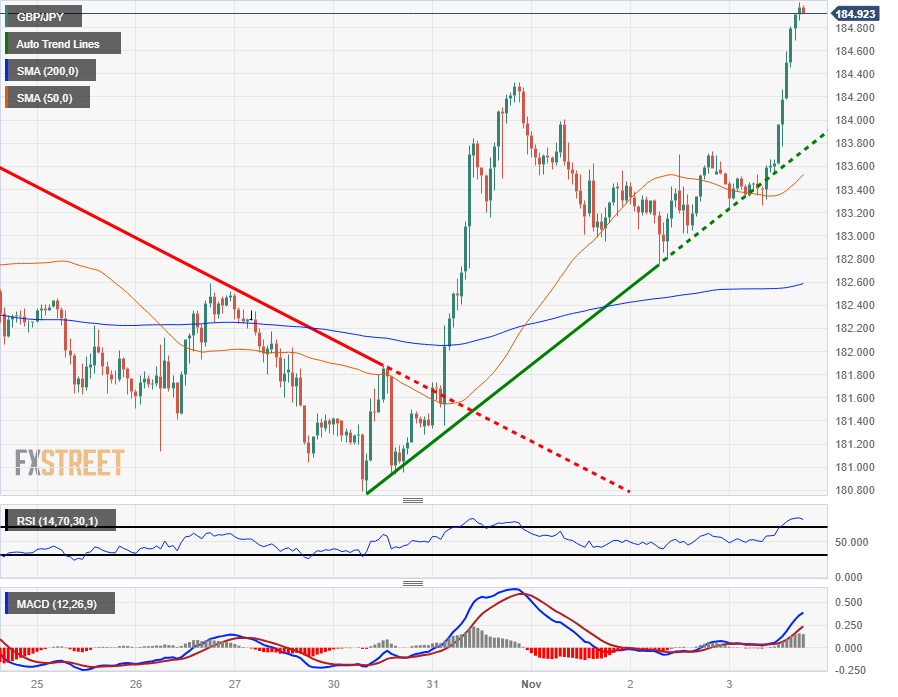
The GBP/JPY caught a bounce off an intraday rising trendline drawn from last week's bottoms near 180.80, and the pair is now trading into an 8-week high near the 150.0 major handle.

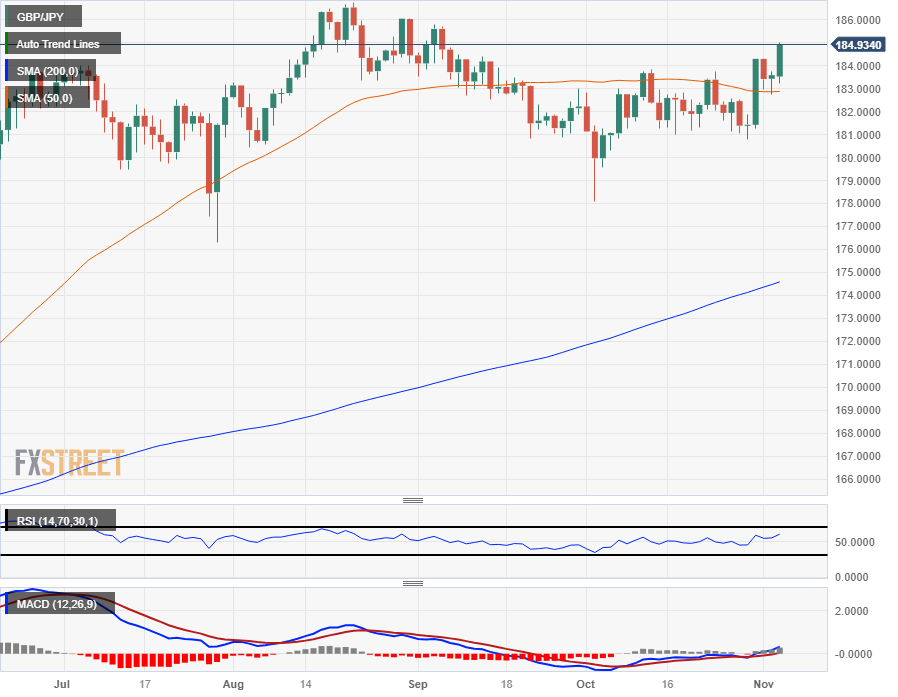
Daily candlesticks have the GBP/JPY trading back into the top side of the 50-day Simple Moving Average (SMA) which is currently grinding sideways near the 183.00 handle, and a bullish extension will see the Guppy set for a break of 2023's highs of 186.77.

Technical support is thin on the down side, but GBP/JPY sellers will be keeping a close eye on price action pulling back towards the last major swing low into the 178.00 level in early October.

GBP/JPY Hourly Chart
GBP/JPY Daily Chart
GBP/JPY Technical Levels

GBP/JPY

Overview
Today last price184.97
Today Daily Change1.39
Today Daily Change %0.76
Today daily open183.58
 
Trends
Daily SMA20182.52
Daily SMA50182.86
Daily SMA100182.74
Daily SMA200174.47
 
Levels
Previous Daily High183.73
Previous Daily Low182.75
Previous Weekly High183.75
Previous Weekly Low181.04
Previous Monthly High184.33
Previous Monthly Low178.08
Daily Fibonacci 38.2%183.36
Daily Fibonacci 61.8%183.12
Daily Pivot Point S1182.98
Daily Pivot Point S2182.38
Daily Pivot Point S3182
Daily Pivot Point R1183.96
Daily Pivot Point R2184.33
Daily Pivot Point R3184.94

Author

Joshua Gibson

Joshua joins the FXStreet team as an Economics and Finance double major from Vancouver Island University with twelve years' experience as an independent trader focusing on technical analysis.


More from Joshua Gibson
Share:

Editor's Picks

GBP/USD strengthens to near 1.3500 as Fed rate hike bets ease

The GBP/USD pair gathers strength to near 1.3495 during the early European trading hours on Friday. The British Pound edges higher against the US Dollar as cooler-than-expected US consumer and producer price data have limited the Federal Reserve's room for further interest rate hikes. Traders will keep an eye on the US July Retail Sales report later on Friday.


EUR/USD gains as receding Fed hike bets weigh on USD; geopolitical risks cap upside

The EUR/USD pair attracts some follow-through buyers during the Asian session, and looks to build on the previous day's modest bounce from the vicinity of the 1.1500 psychological mark, or an over one-week low. Spot prices, however, remain confined in a two-week-old range and currently trade below 1.1550 amid mixed cues.

Gold finds some support ahead of $4,300 as USD remains depressed on receding Fed hike bets

Gold attracts some follow-through selling for the second consecutive day and retreats further from its highest level since June 5, around $4,450, which it touched the previous day. The commodity, however, finds some support ahead of the $4,300 mark as traders refrain from placing aggressive directional bets amid mixed fundamental cues.

Ethereum on-chain signal remains weak even as mild retail distribution continues

Ethereum (ETH) continued to consolidate in the tight $1,800-$2,000 range amid weak signals across key on-chain metrics. ETH Exchange Netflow, which measures the difference between coins flowing in and out of exchanges, indicates mild dominance in selling activity after its 14-day moving average flipped positive.

Dollar dominance is cracking and the Fort Knox Gold question won’t go away

Imagine somebody repeatedly claiming to have $100,000 in the bank but refusing to produce a statement or even balance the checkbook. The money might be there, but without verification, skepticism would be reasonable.

Why is Crude Oil priced for a reopening the ships haven't made?
Fourteen vessels crossed the Strait of Hormuz on Tuesday. Before the war, the count ran near 120 a day. In the sessions since the waterway was publicly declared open, Brent has drifted back to $87 and West Texas Intermediate (WTI) to $81, both a little lower again on Wednesday, with daily momentum on each unwound from the top of its range in late July to the low twenties now.