GBP/JPY cools its heels just above 199.00 in quiet Thursday action
- GBP/JPY pumps the brakes as the pair churns near 200.00.
- Thin economic calendar this week allows the Guppy to find balance.
- Hectic data schedule on the cards for next week.

GBP/JPY is cruising through a data-light week, cycling between 200.00 and 199.00 as investors await higher-impact calendar releases from both the UK and Japan. The Volatility-prone pair has found a brief cool spot despite the Guppy holding up over 11% for the year.
This week saw strictly low-impact data releases from the UK and Japan, though investors are keeping a close eye on any statements from the Bank of Japan (BoJ). Policymakers at the Japanese central bank are slowly getting pushed towards making trims to their various easing and bond-buying programs, but a deep-seated fear of a return to stagnant inflation conditions in Japan has kept the BoJ in a hyper-easy policy stance.
A battered Yen has been pushed deeply into the red through 2024 as wide rate differential force the JPY lower across the board, but impending rate cuts from most of the global major central banks is set to ease some pressure and trim the differential, which could give the beleaguered JPY a leg up.
Next week, Japanese Q1 Gross Domestic Product (GDP) figures are due early Tuesday, though investors broadly expect Japanese GDP growth to hold near -0.5% QoQ. On the UK side, fresh labor figures are also due on Tuesday, and the UK is expected to shed -177K jobs in the three months ended April.
GBP/JPY technical outlook
Near-term momentum has drained out of the Guppy as prices slump into the midrange, planted firmly just above the 199.00 handle with the 200-hour Exponential Moving Average (EMA) at 199.33. GBP/JPY hit a record 34-year high at 200.75 in late May, and the pair has steadied after a recent plunge towards 197.00.
GBP/JPY hourly chart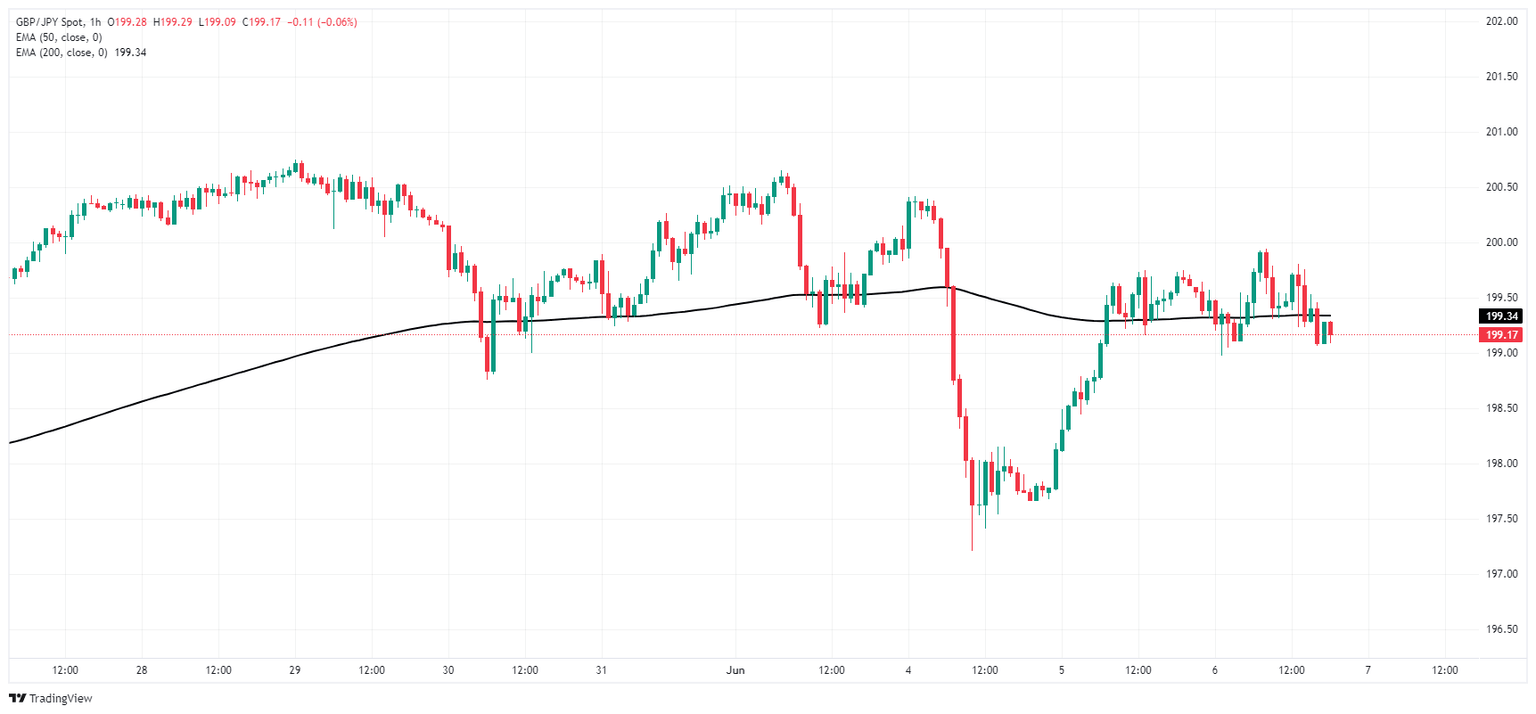
GBP/JPY daily chart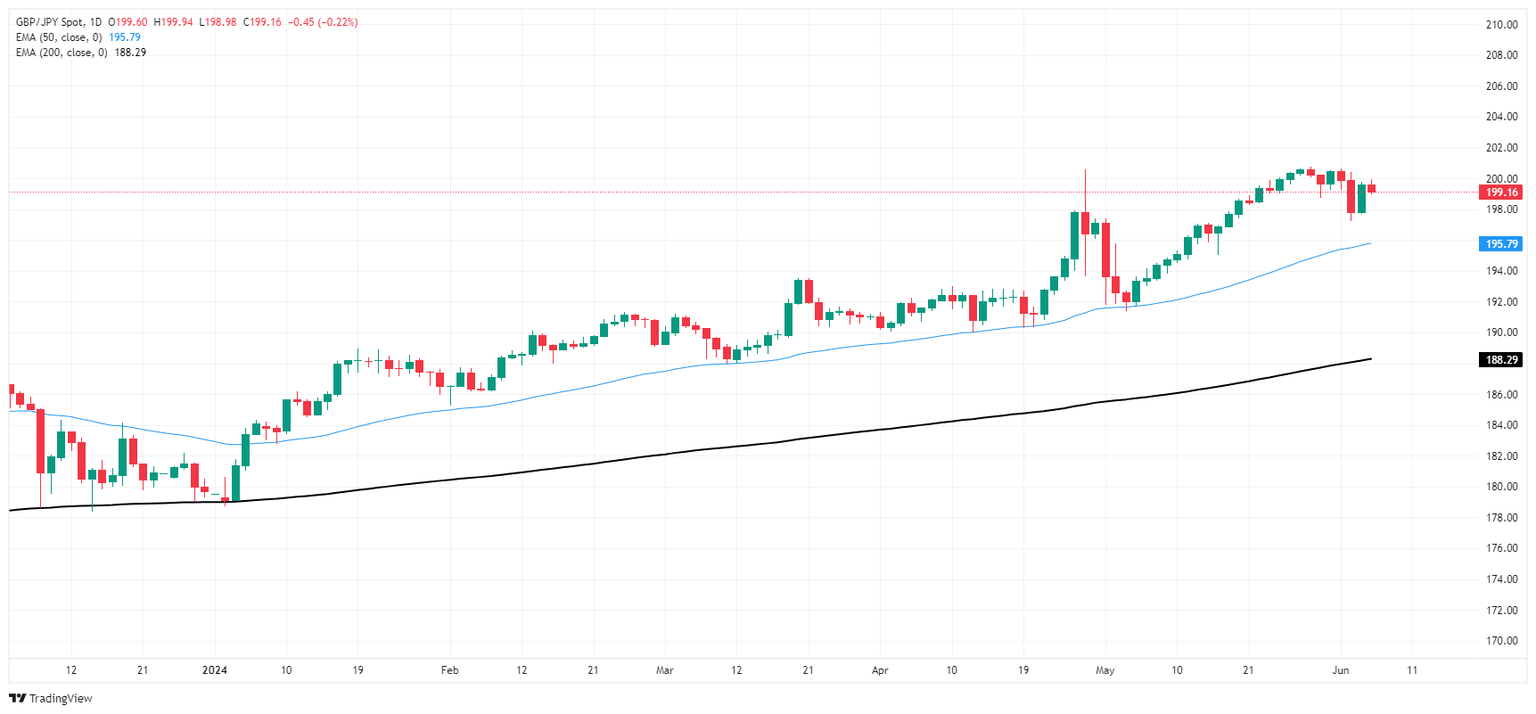
Author

Joshua Gibson
FXStreet
Joshua joins the FXStreet team as an Economics and Finance double major from Vancouver Island University with twelve years' experience as an independent trader focusing on technical analysis.


