|

GBP/CAD Price Prediction: Uptrend extends to upper channel line

  • GBP/CAD has rallied up to resistance at the upper channel line of a rising channel. 
  • It is at an important crossroads. The uptrend holds but price is diverging bearishly with MACD.

GBP/CAD has rallied up to a new high for 2024 and reached the top trendline of a long-term rising channel. Although it is in a strong uptrend the top of the channel is likely to exert tough resistance and there is a risk of a pullback and countertrend correction unfolding. The pair has reached a critical level. 

GBP/CAD Daily Chart 

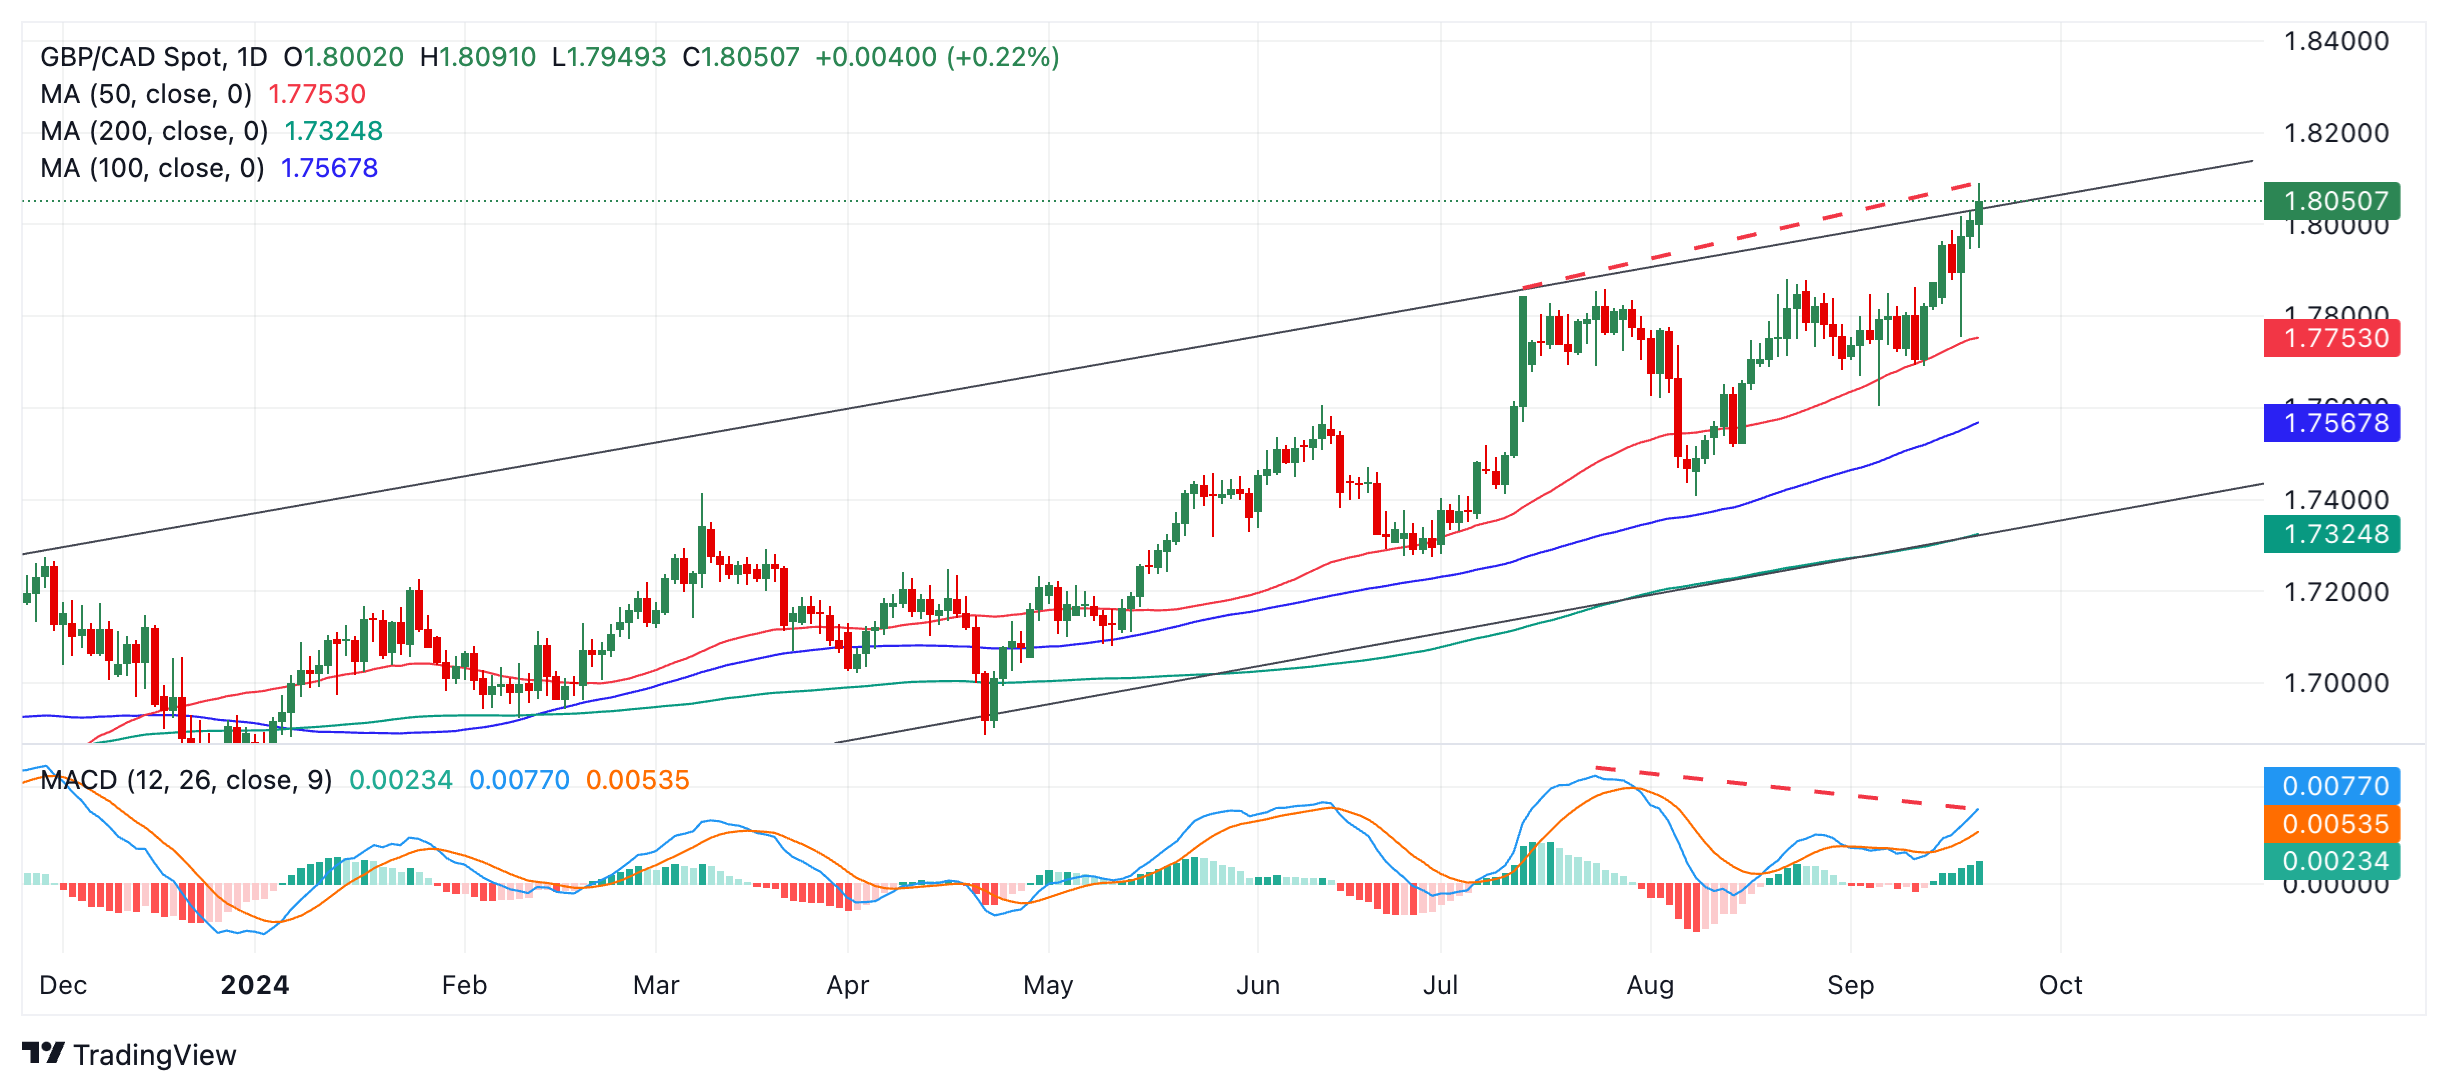
GBP/CAD is showing bearish divergence with the Moving Average Convergence Divergence (MACD) momentum indicator (red dashed lines). Although price has risen to a higher high compared to July 12, the MACD is actually lower than the level it was at on July 12. This is a bearish sign and suggests a higher chance of a pull back evolving. 

An initial target for such a pull back might be the 50-day Simple Moving Average (SMA) at 1.7753. 

That said, price itself has not formed any kind of reversal pattern yet. It is also in an uptrend on all three major time frames – the short, medium and long-term. This suggests that overall the current is flowing north. Given it is a principle of technical analysis that “the trend is your friend” the odds favor more upside.

Given the resistance above, however, price would have to decisively break above the upper channel line to confirm a continuation. 

A decisive break would be one accompanied by a long green candlestick that closed near its high well above the channel line, or three green candlesticks in a row that close well above the trendline. A close above the 1.8091 yearly high would confirm such a breakout, for example. 

Such a breakout might reach a target at 1.8278 the 61.8% extrapolation of the prior move higher. 

Author

Joaquin Monfort

Joaquin Monfort is a financial writer and analyst with over 10 years experience writing about financial markets and alt data. He holds a degree in Anthropology from London University and a Diploma in Technical analysis.

More from Joaquin Monfort
Share:

Editor's Picks

AUD/USD eyes 0.7150 barrier nine-day EMA

AUD/USD inches higher after registering modest losses in the previous day, trading around 0.7130 during the Asian hours. The technical analysis of the daily chart indicates that the pair is moving sideways within the rectangle pattern, suggesting a consolidation as neither the bulls nor the bears have enough momentum to take control of the market.

USD/JPY trades below 160.00 intervention threshold; bullish bias intact

The USD/JPY pair attracts some sellers during the Asian session amid fears that authorities will step in again to prop up the Japanese Yen. Furthermore, the Israel-Lebanon truce prompts some profit-taking around the US Dollar and exerts downward pressure on the currency pair.

Gold rebounds from one-week low as Israel-Lebanon truce pressures safe-haven USD

Gold gains some positive traction on Thursday and climbs to the $4,475 area during the Asian session, reversing a major part of the previous day's slide to a one-week low. The Israel-Lebanon truce prompts some profit-taking around the US Dollar and supports the commodity. 


Hyperliquid: ETF demand, capital rotation fuel HYPE rally as Bitcoin melts

Hyperliquid price sustains an upward trend near its all-time high of $75.76 on Thursday after posting 80% gains in May, while Bitcoin (BTC) retraces below $65,000, triggering a market-wide panic.

Kevin Warsh takes the Fed helm: What it means for the US Dollar
The Federal Reserve moves away from the highly predictable "forward guidance" model of the Jerome Powell era to a new “Kevin Warsh environment”, characterized by less communication, more policy surprises, and an increased focus on the Fed's complex balance sheet.
Recession on paper: What really moves the Canadian Loonie now?

Statistics Canada handed the headline writers a gift and the analysts a headache. Real GDP shrank 0.1% on an annualized basis in the first quarter, and with the fourth quarter of 2025 revised down to a 1.0% contraction, that is two negative quarters in a row, the textbook definition of a technical recession and Canada's first since the pandemic.