|

GBP/CAD Price Forecast: Down leg extends within rising channel

  • GBP/CAD has declined sharply within a rising channel. 
  • The pair is likely to continue lower as the counter-trend reaction runs its course. 

GBP/CAD is unfolding a down leg within a rising channel. It will probably continue lower to at least the blue 100-day Simple Moving Average (SMA) at 1.7641. A break below the 1.7720 October 3 low would cement bearish bets. 

The pair is in a short-term downtrend and given the principle that “the trend is your friend” the odds favor a continuation of that trend. 

GBP/CAD Daily Chart 


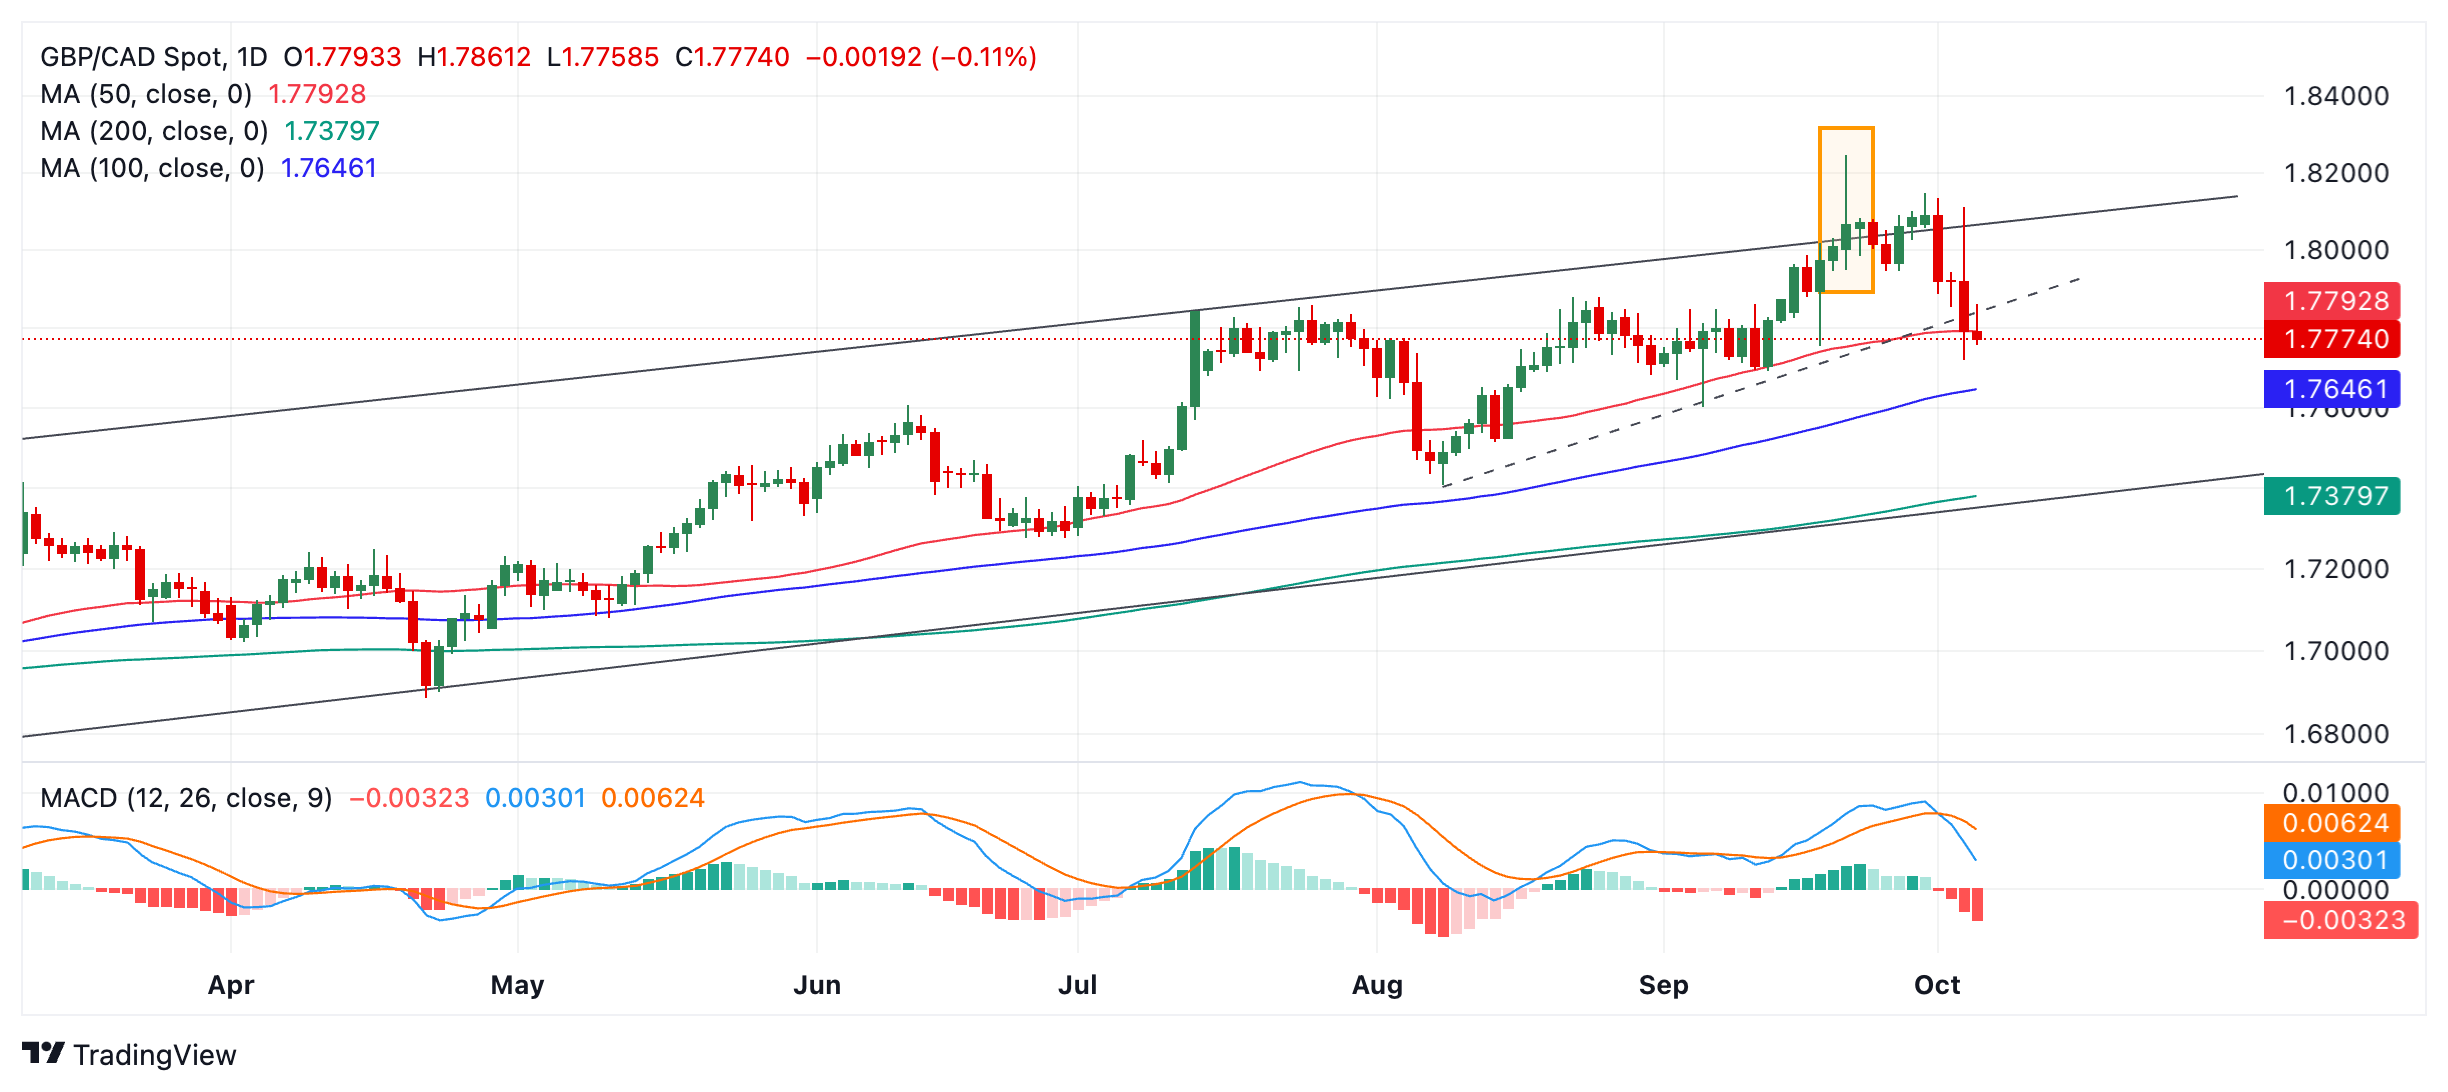
Subsequent downside targets lie at 1.7603 (September 4 low) and 1.7407 (August 8 low). In the most bearish scenario price could fall to the lower channel line at 1.7375. 

That said, short-holders are advised to exercise caution as GBP/CAD is in an uptrend on the medium and long-term timeframes, as it oscillates higher within an ascending channel. There is a risk, therefore, of a reversal higher occurring unless the current sell-off marks the beginning of a deeper downtrend. This is possible given its steepness. 

The Moving Average Divergence Convergence (MACD) has crossed sharply below its signal line providing added bearish confirmation. 

The formation of a bearish Shooting Star Japanese candlestick reversal pattern on September 20 (orange rectangle on chart above) gave the first signs of weakness. It then consolidated for a while before starting to fall properly on October 1.


Author

Joaquin Monfort

Joaquin Monfort is a financial writer and analyst with over 10 years experience writing about financial markets and alt data. He holds a degree in Anthropology from London University and a Diploma in Technical analysis.

More from Joaquin Monfort
Share:

Editor's Picks

AUD/USD eyes 0.7150 barrier nine-day EMA

AUD/USD inches higher after registering modest losses in the previous day, trading around 0.7130 during the Asian hours. The technical analysis of the daily chart indicates that the pair is moving sideways within the rectangle pattern, suggesting a consolidation as neither the bulls nor the bears have enough momentum to take control of the market.

USD/JPY trades below 160.00 intervention threshold; bullish bias intact

The USD/JPY pair attracts some sellers during the Asian session amid fears that authorities will step in again to prop up the Japanese Yen. Furthermore, the Israel-Lebanon truce prompts some profit-taking around the US Dollar and exerts downward pressure on the currency pair.

Gold rebounds from one-week low as Israel-Lebanon truce pressures safe-haven USD

Gold gains some positive traction on Thursday and climbs to the $4,475 area during the Asian session, reversing a major part of the previous day's slide to a one-week low. The Israel-Lebanon truce prompts some profit-taking around the US Dollar and supports the commodity. 


Hyperliquid: ETF demand, capital rotation fuel HYPE rally as Bitcoin melts

Hyperliquid price sustains an upward trend near its all-time high of $75.76 on Thursday after posting 80% gains in May, while Bitcoin (BTC) retraces below $65,000, triggering a market-wide panic.

Kevin Warsh takes the Fed helm: What it means for the US Dollar
The Federal Reserve moves away from the highly predictable "forward guidance" model of the Jerome Powell era to a new “Kevin Warsh environment”, characterized by less communication, more policy surprises, and an increased focus on the Fed's complex balance sheet.
Recession on paper: What really moves the Canadian Loonie now?

Statistics Canada handed the headline writers a gift and the analysts a headache. Real GDP shrank 0.1% on an annualized basis in the first quarter, and with the fourth quarter of 2025 revised down to a 1.0% contraction, that is two negative quarters in a row, the textbook definition of a technical recession and Canada's first since the pandemic.