GBP/CAD Price Analysis: Bears have the upper hand below counter-trendline resistance
- 1.7350's are holding, so far, on the retest in a bearish environment.
- GBP/CAD bears taking charge below hourly counter-trendline resistance.
As per the start of the week's analysis:
... the price has indeed broken below the 1.7350 structure which gives rise to the prospects, in line with the analysis, to the downside.
Prior analysis, daily and 4-hour charts
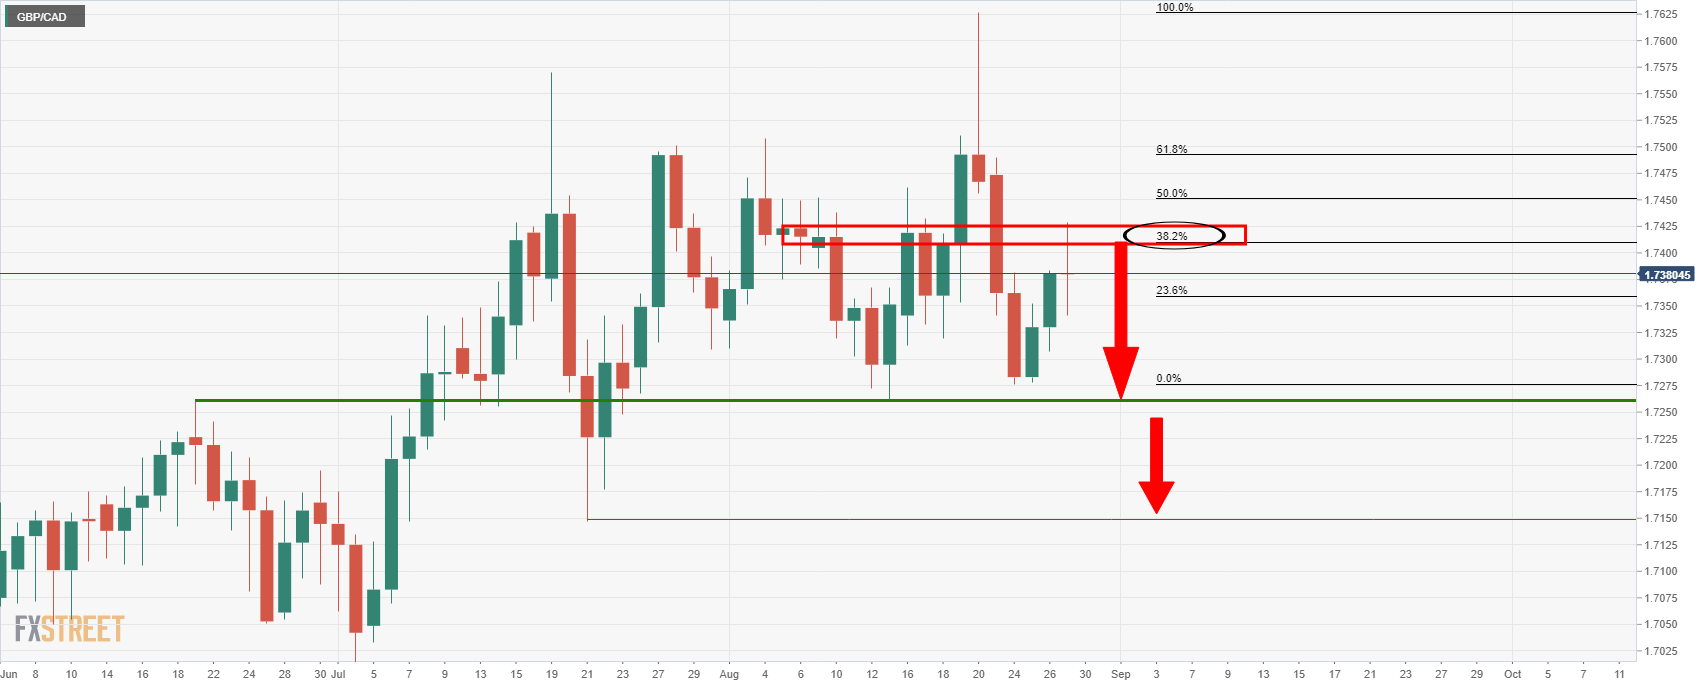
''This leaves prospects of a daily doji in failures to hold above the 38.2% Fibo.
A break of the monthly neckline in the 1.7260s opens risk to 1.7180 as a -61.8% of the daily correction's range ahead of the July 21 lows of 1.7150.''
4-hour chart
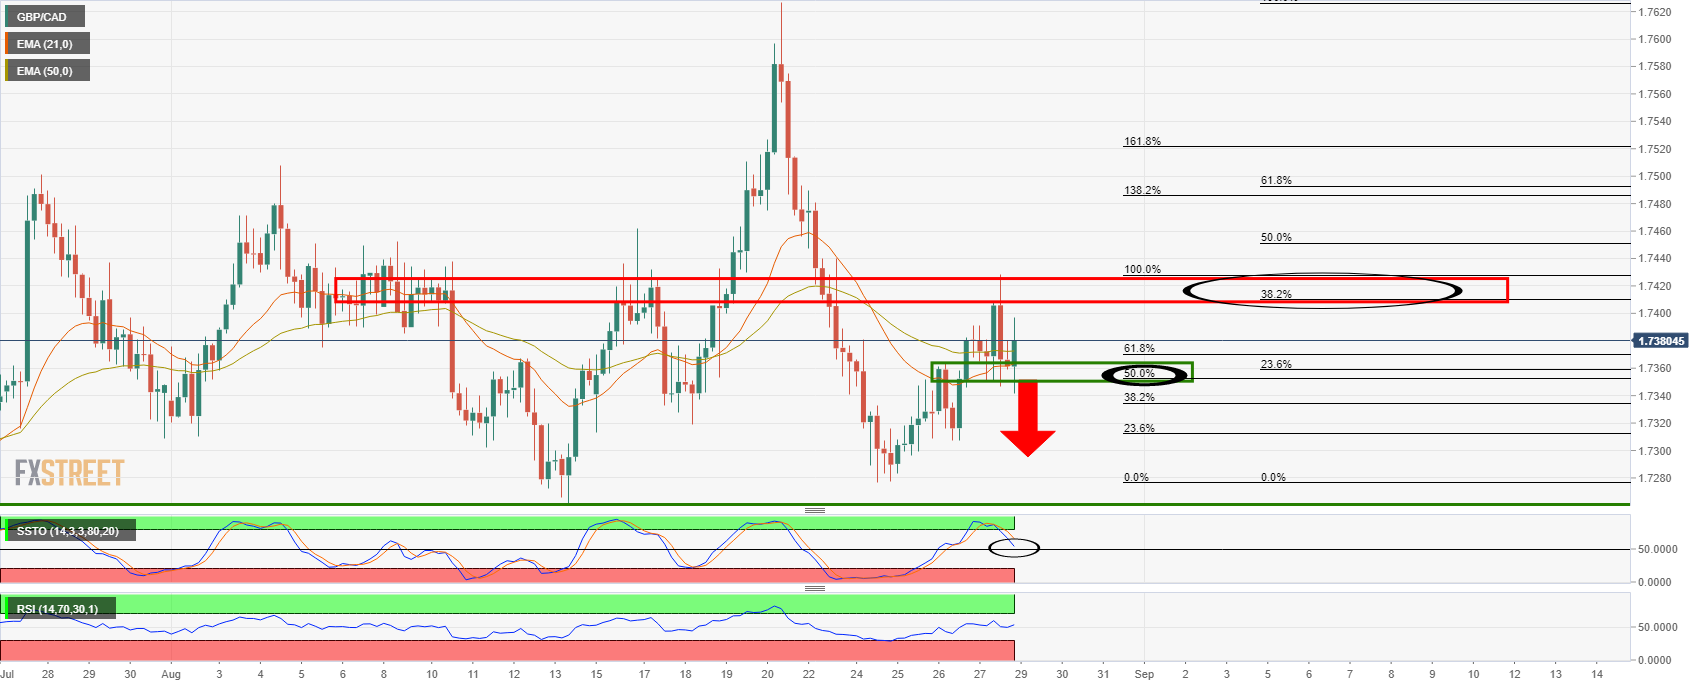
''The 21 EMA remains below the 50 EMA, and that is bearish.
The Slow Stochastic Oscillator is also bearish and on the verge of penetrating 50 as is the Relative Strength Index (RSI).
Sell orders near the 50% mean reversion will likely be the tipping point for the cross, making for a level below 1.7350 an optimal entry point.''
Live market, 4-hour chart
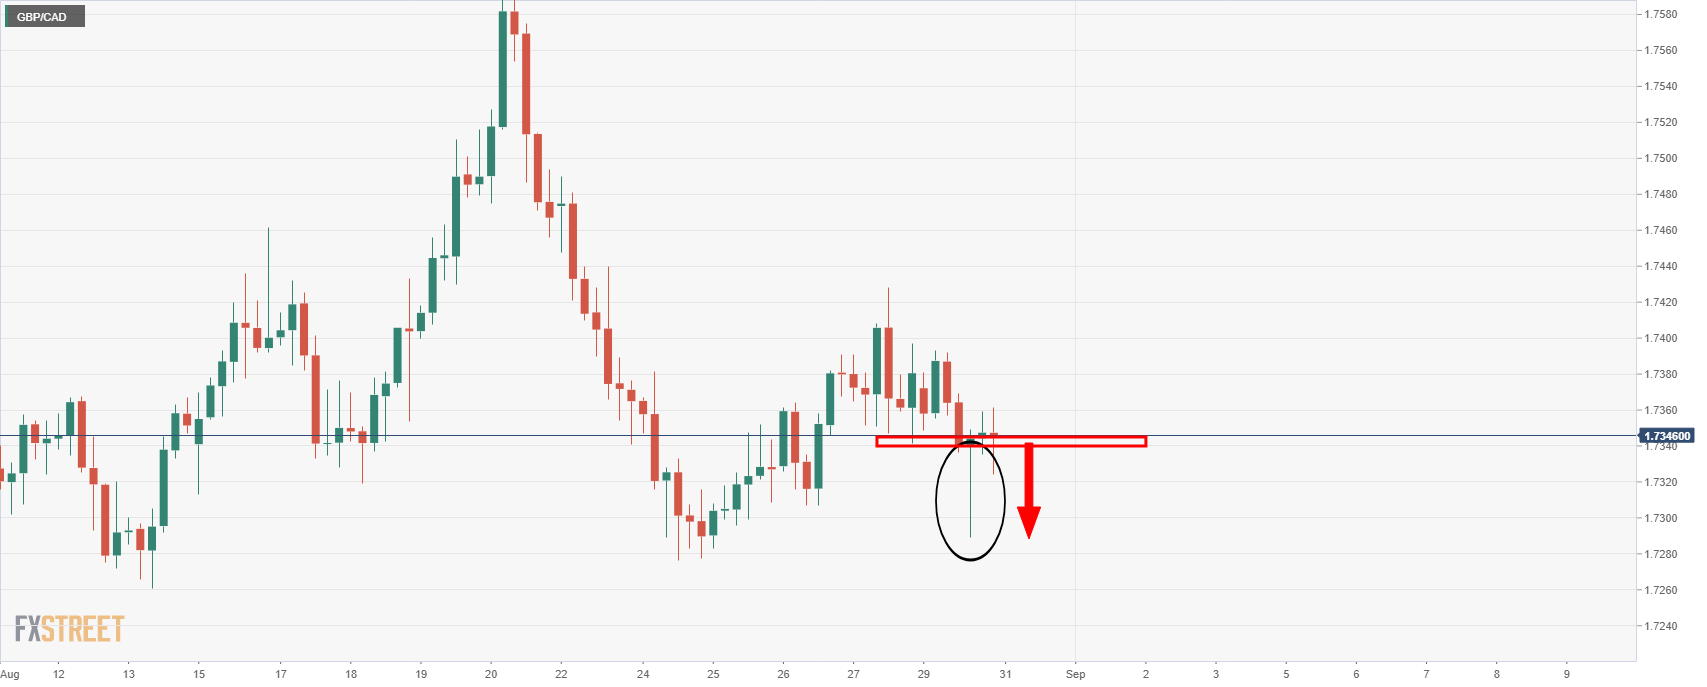
The price dropped, filling sell stops and sell limits on the return to what is now considered as resistance.
The 4-hour wick represents the lower time frame price action and would be expected to be filled by subsequent failures at resistance resulting in a downside move:
Hourly chart
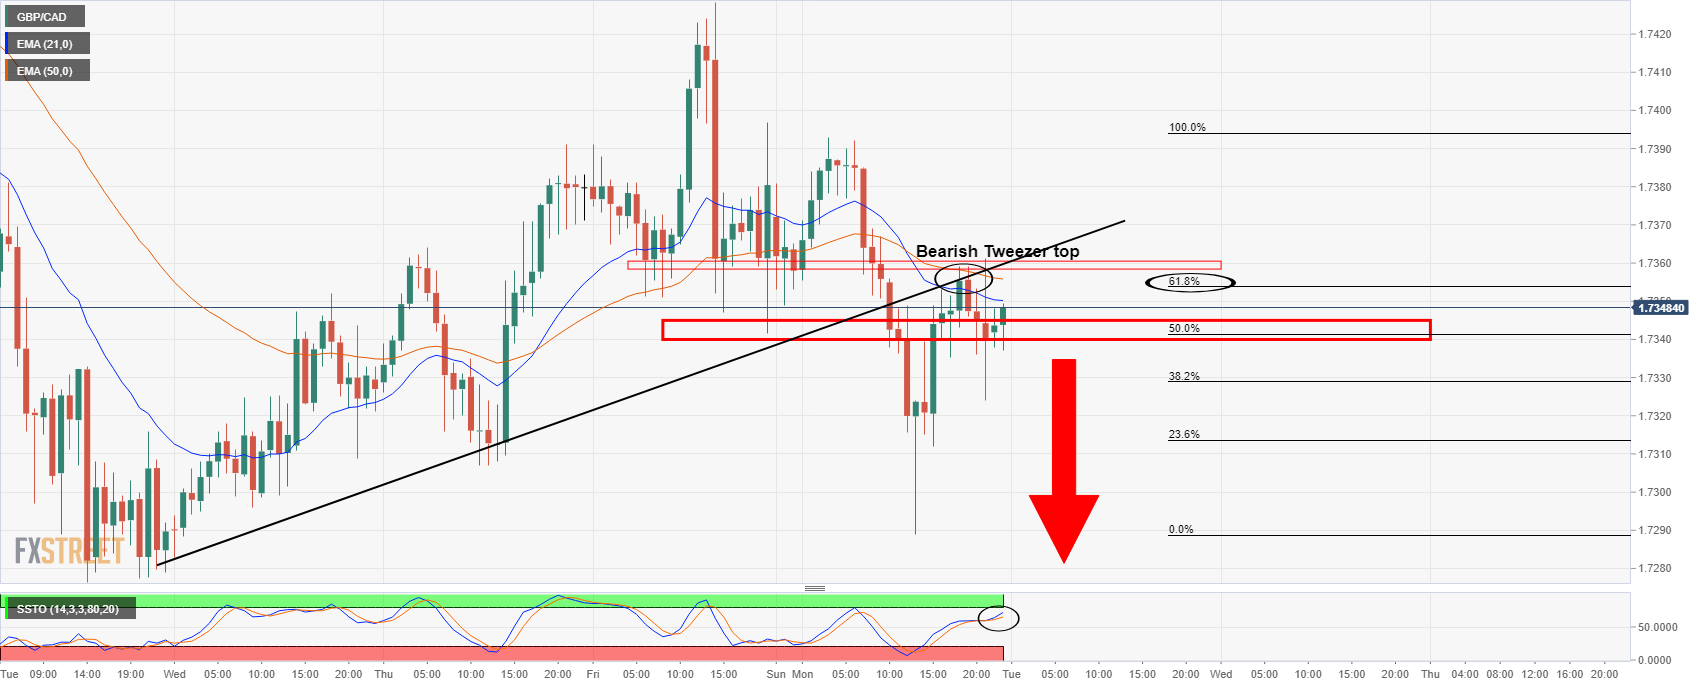
The price has been rejected by the counter-trendline, following a tweezer top and is submerged below the bearish 50/21 EMA crossover.
More conservative bears could be waiting for the SSTO bearish crossover for further confirmation, besides all of the above confluences already in play.
Author

Ross J Burland
FXStreet
Ross J Burland, born in England, UK, is a sportsman at heart. He played Rugby and Judo for his county, Kent and the South East of England Rugby team.


