Chart of the Week: GBP/CAD is ripening for a short below 1.7350
- US dollar is under pressure and makes way for trading opportunities in forex.
- The commodity complex has been given a boost in positive sentiment.
- CAD crosses are in focus, GBP/CAD is ripening for a shorting opportunity below 1.7350.

An interesting fundamental development in forex markets occurred on Friday that tips the balance of favouritism to the commodity complex, supporting the outlook for AUD, NZD and CAD specifically.
The greenback is on the back foot:
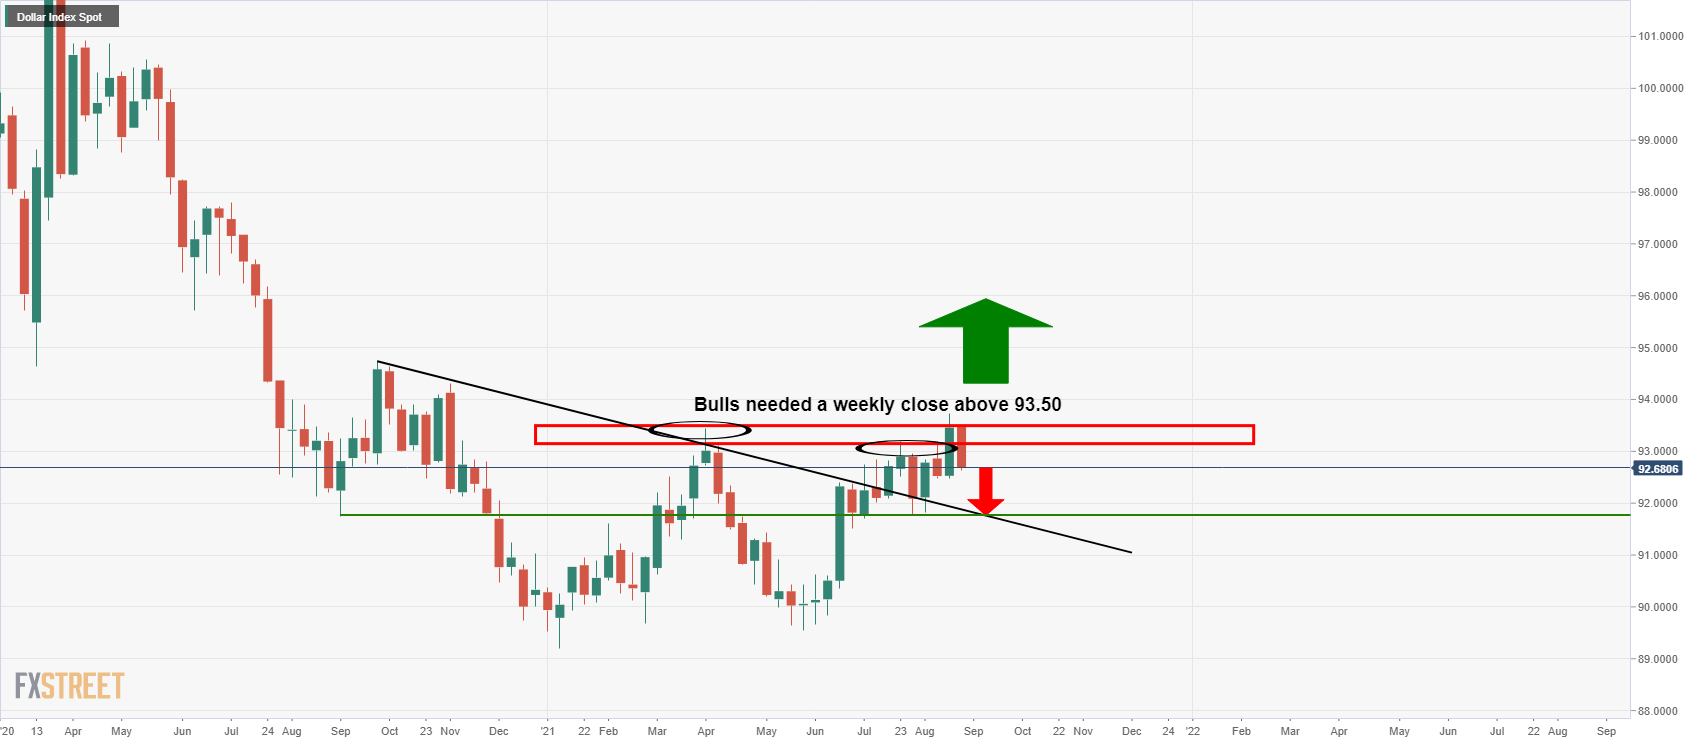
DXY daily and weekly charts
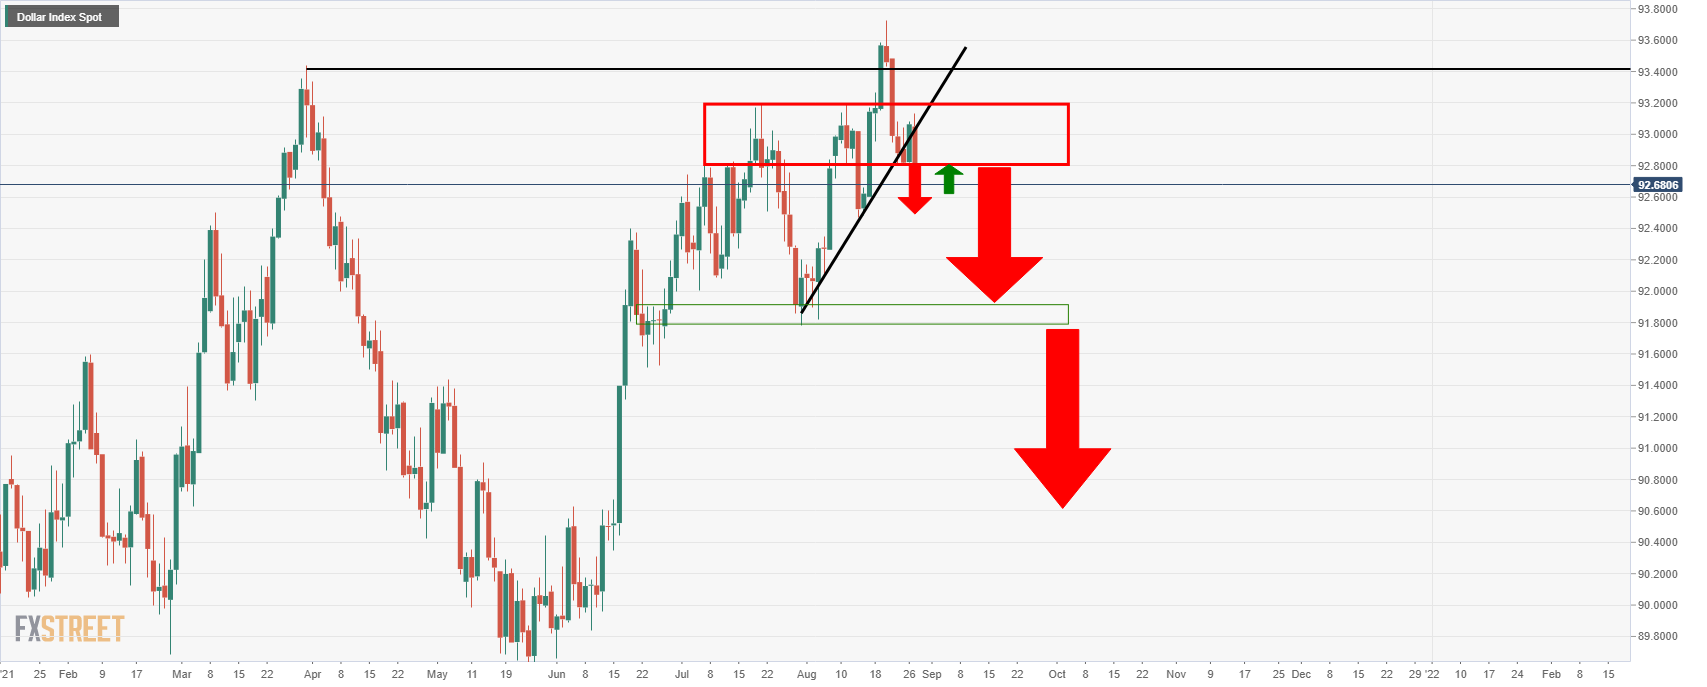
From a daily perspective, the DXY is testing the grounds for a breakout below the dynamic support, and it failed to close above 93.50 on a weekly basis.
This leaves the focus on 91.80 support:
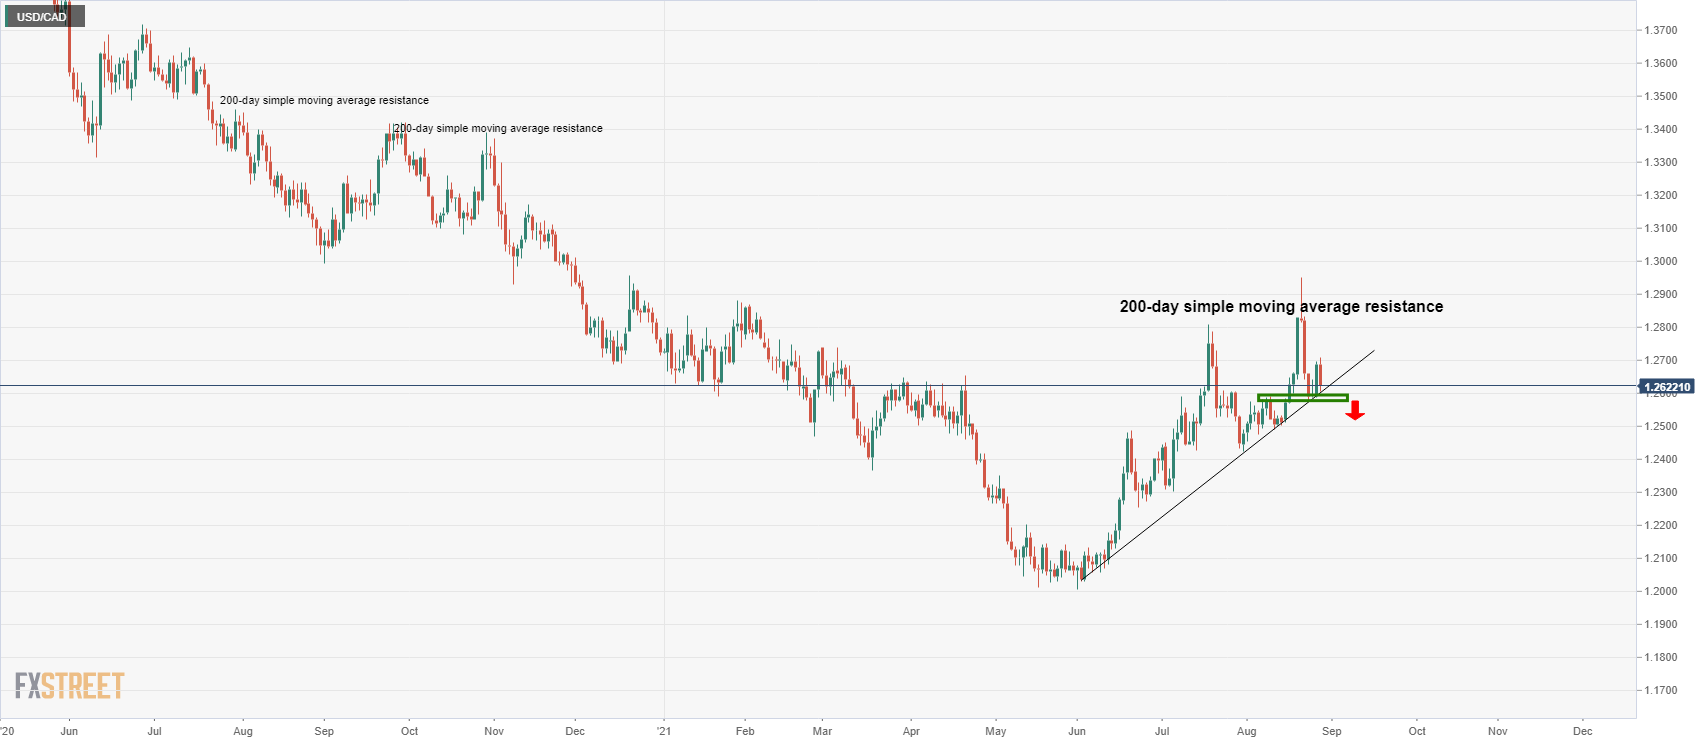
USD/CAD analysis
Meanwhile, in a soft US dollar environment, combined with the prior failures to sustain a bullish move beyond the 200-day Simple Moving Average (SMA), USD/CAD is on the verge of a bearish breakout below dynamic support as follows:
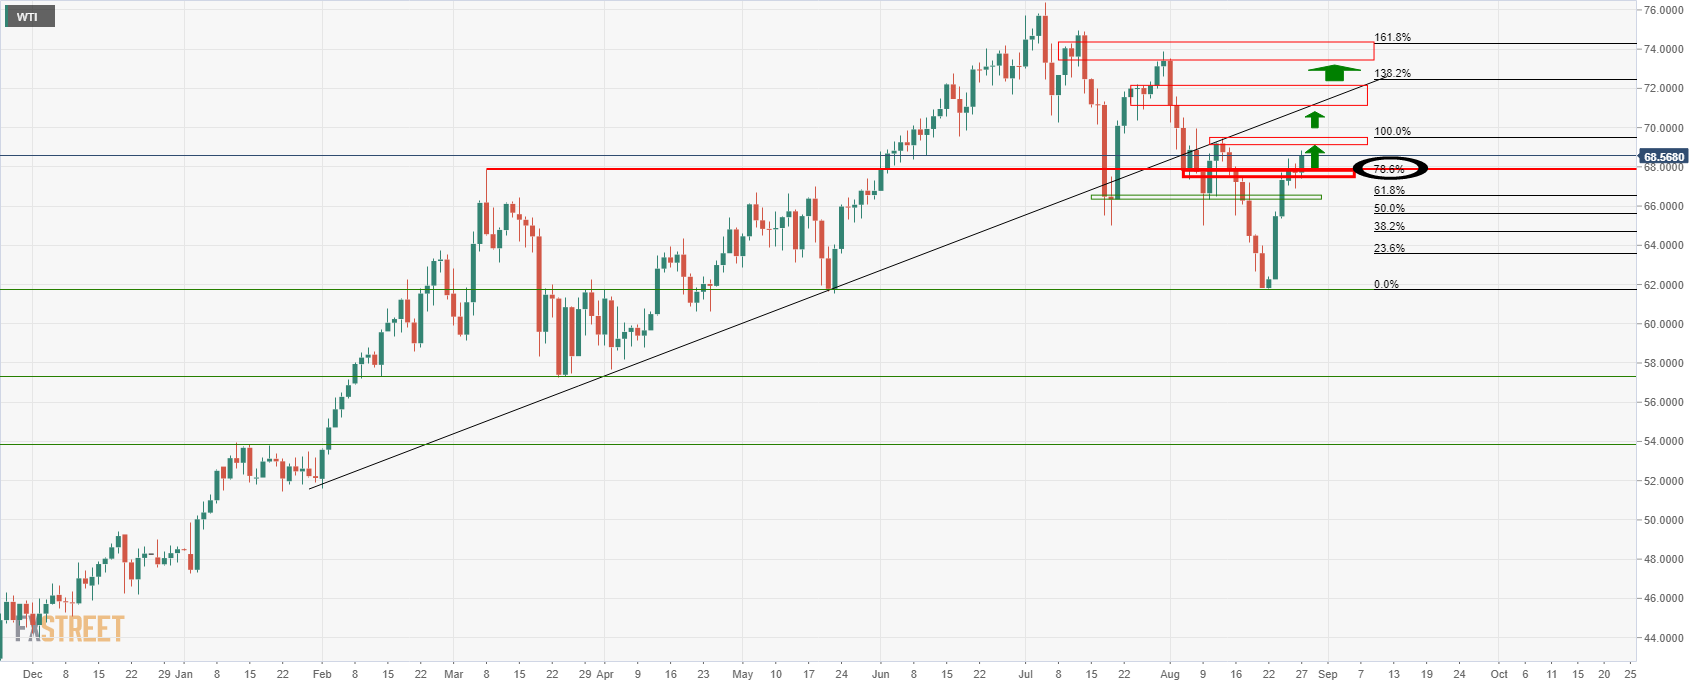
While above the 78.6% Fibonacci, the prospects of a rise in WTI toward $69.50 due to the start of the week's Gulf Hurricane Ida fundamentals should also play into the hands of the Canadian dollar:
GBP/CAD analysis
Looking at the crosses, the most compelling prospect comes with a multi time frame analysis on GBP/CAD in a potential high probability set-up from a swing trading perspective.
Starting on the monthly outlook, we are in the final days of August, and there are prospects of a bearish close as follows:
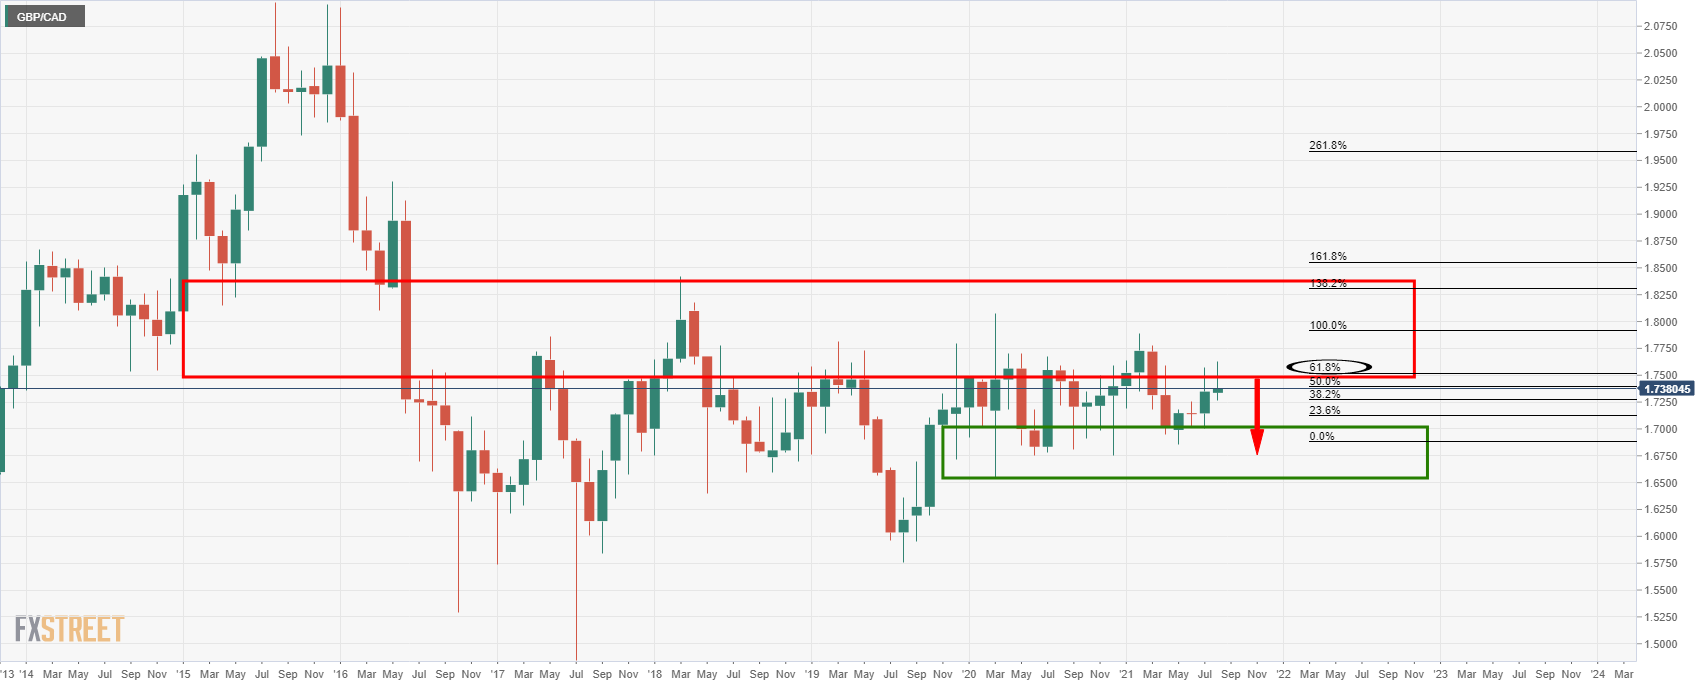
A bearish shooting star candle will be left if the price closes below 1.7346.
The fact that the candle has already tested supply territory and failed near the 61.8% Fibo is bearish in itself.
The W-formation is also bearish, and the wick has a confluence with the 61.8% Fibo of the last bullish impulse for a target:
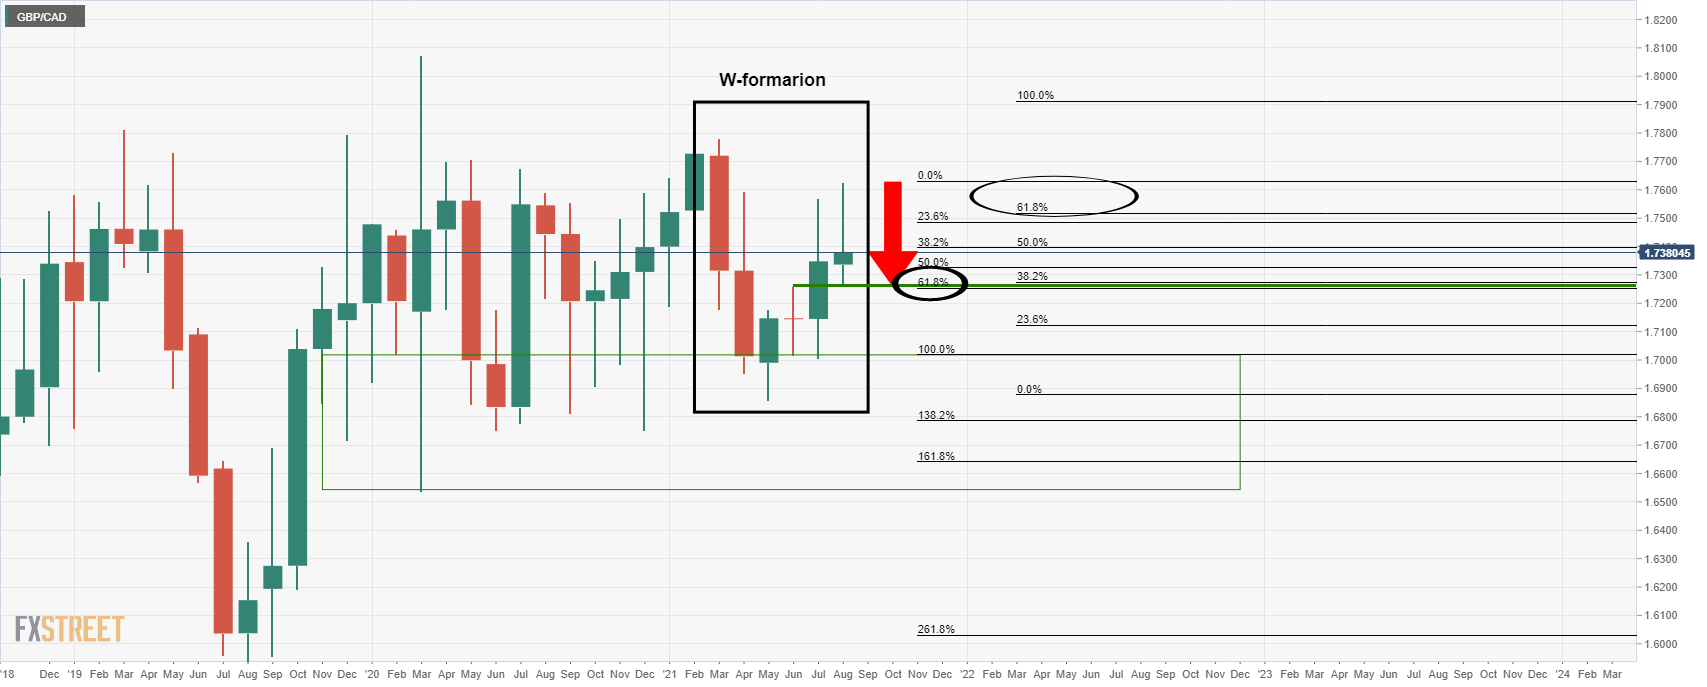
Weekly chart
Moving down to the weekly chart, the price closed bearish, and the wick's lows can be targeted for the week ahead:
The weekly wick represents the daily bullish correction that would be expected to lead to a downside daily bearish continuation toward and/or beyond the 61.8% weekly Fibo and monthly W-formation neckline, as follows:
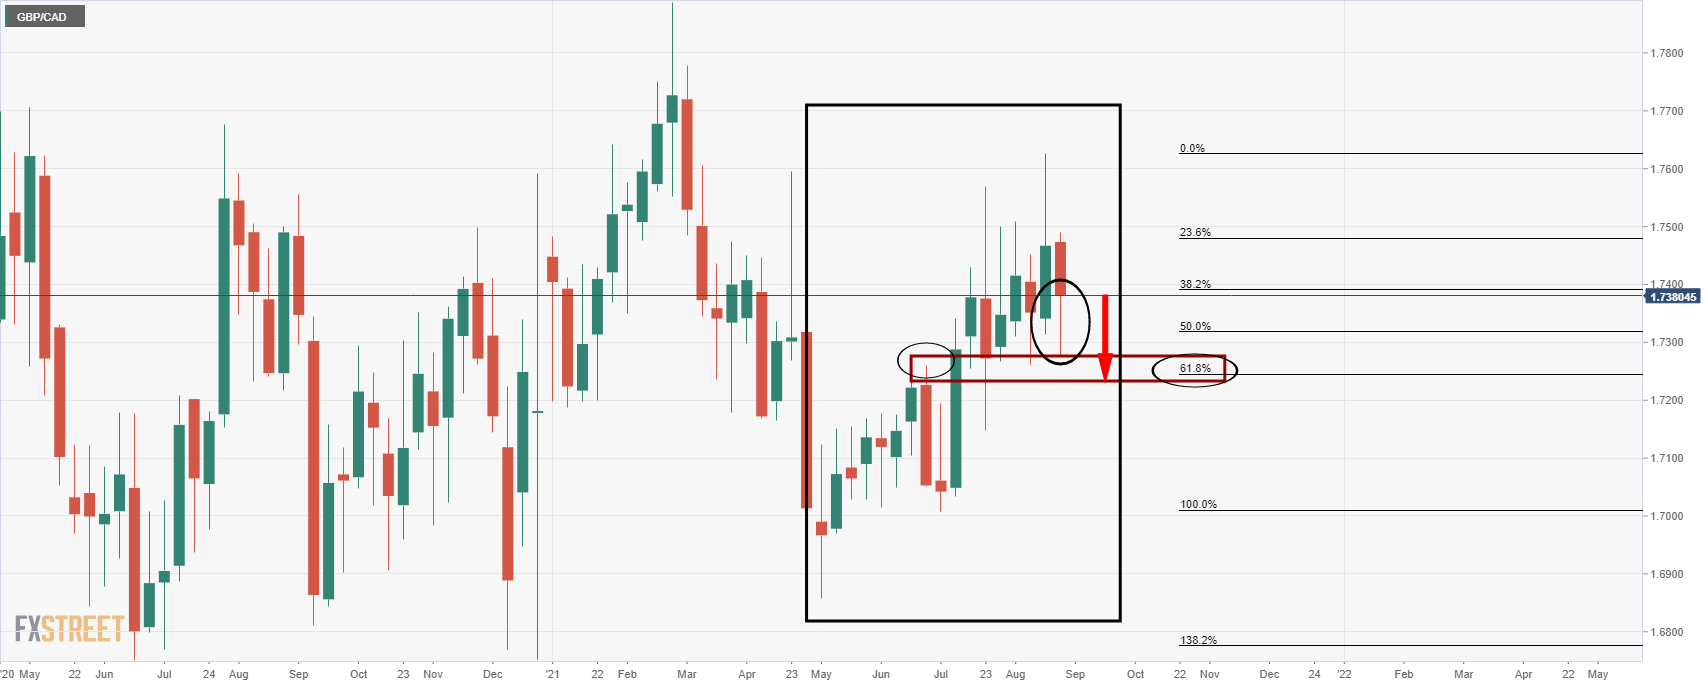
Daily chart
This leaves prospects of a daily doji in failures to hold above the 38.2% Fibo.
A break of the monthly neckline in the 1.7260s opens risk to 1.7180 as a -61.8% of the daily correction's range ahead of the July 21 lows of 1.7150.
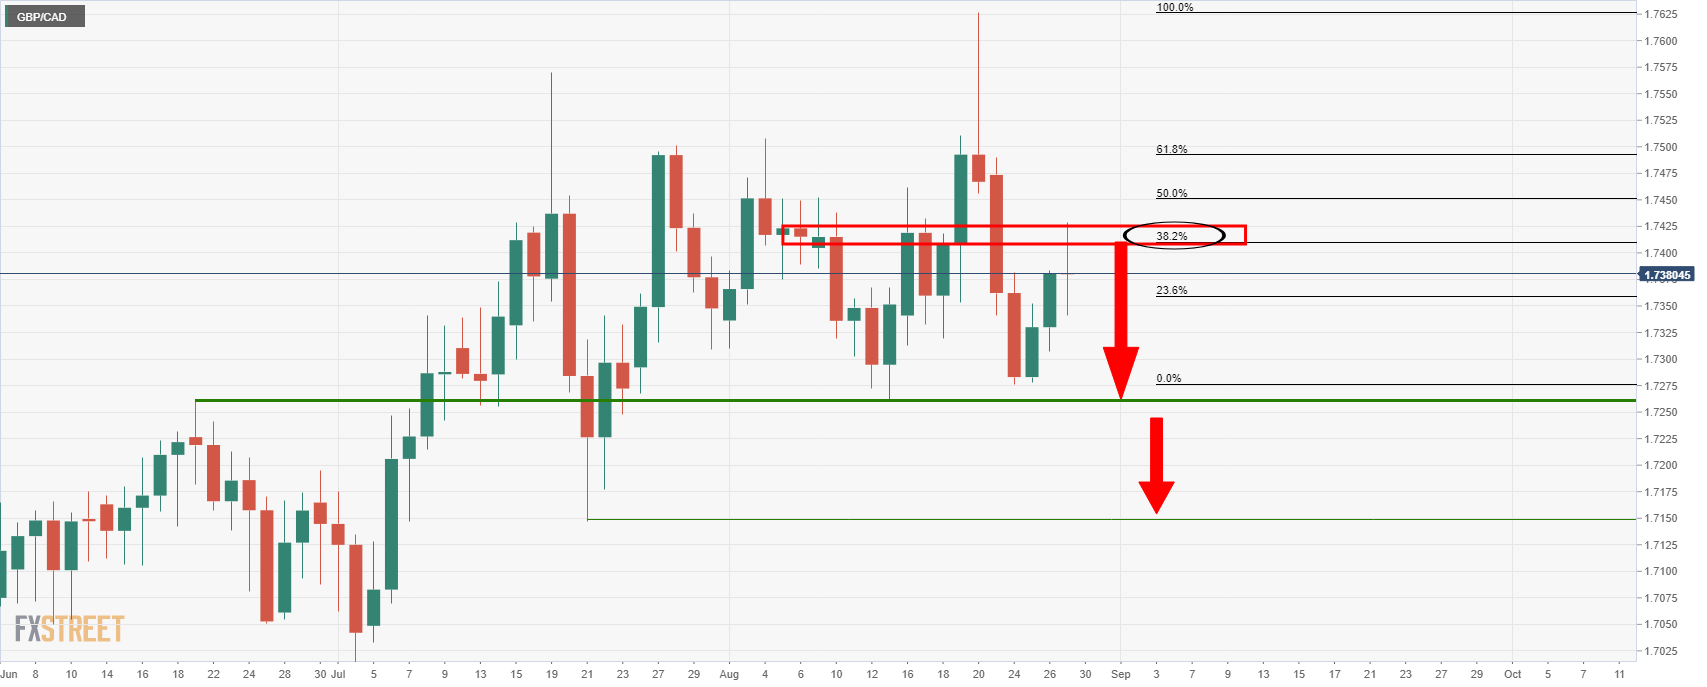
4-hour chart
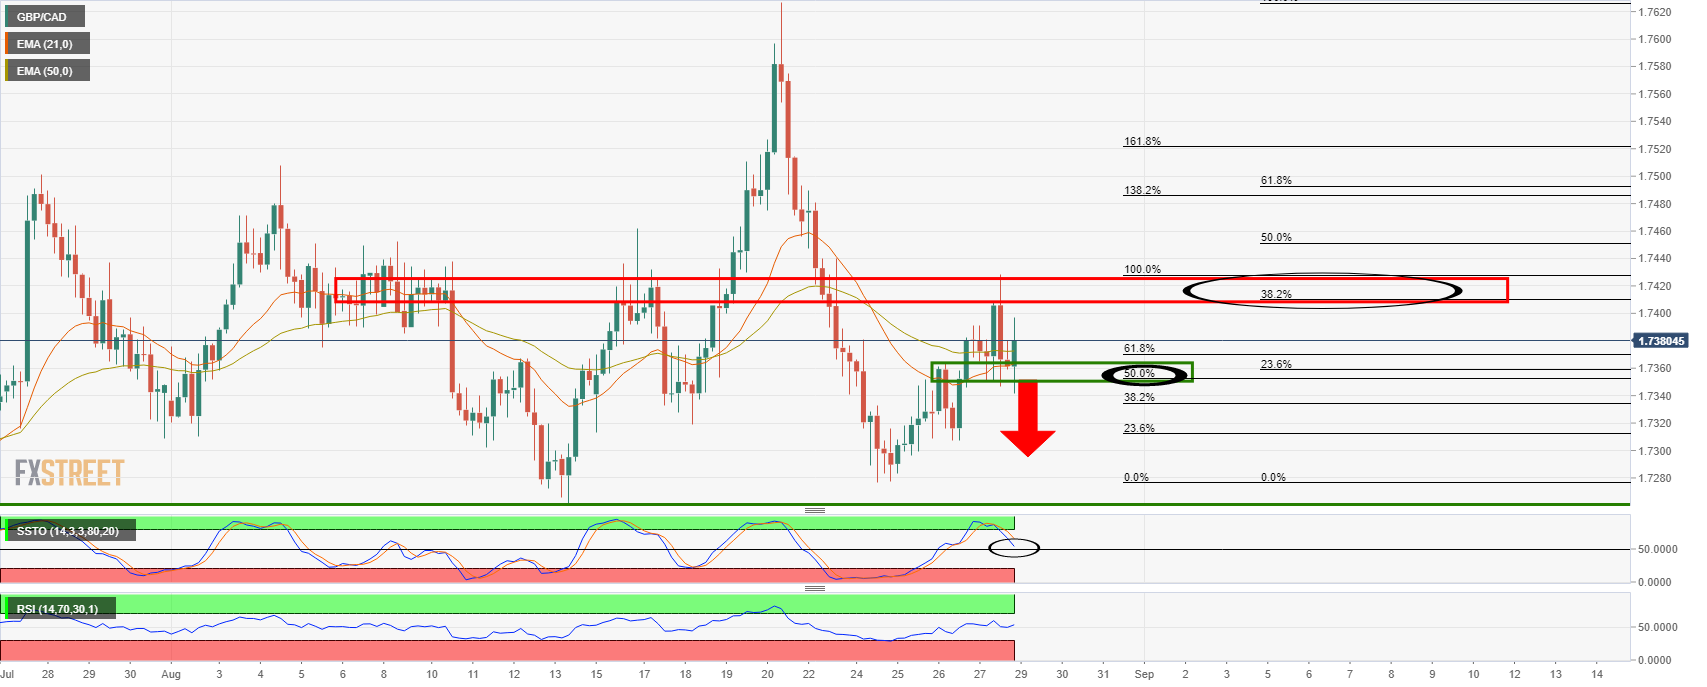
The 21 EMA remains below the 50 EMA, and that is bearish.
The Slow Stochastic Oscillator is also bearish and on the verge of penetrating 50 as is the Relative Strength Index (RSI).
Sell orders near the 50% mean reversion will likely be the tipping point for the cross, making for a level below 1.7350 an optimal entry point.
Premium
You have reached your limit of 3 free articles for this month.
Start your subscription and get access to all our original articles.
Author

Ross J Burland
FXStreet
Ross J Burland, born in England, UK, is a sportsman at heart. He played Rugby and Judo for his county, Kent and the South East of England Rugby team.


