GameStop Stock Price and Forecast: Is GME going to break $100?
- GameStop shares fall further on Monday as the meme massacre continues.
- GME stock is down 12% in 2022.
- Growth, tech and memes suffer as rates rise and investors rotate.
Investor rotation is on, and this week is likely to see that trend continue with financial stocks reporting on Friday. Also up this week is inflation data, which is likely to show a continued heating up and the total lack of transitory inflation. Goldman Sachs has already added a fourth rate hike to its predictions for 2022, and fed funds futures are now looking at the nailed-on certainty of a March hike. All this has not helped the so-called high growth space. Tech fits neatly into this category, while meme is a category all of its own.
GameStop (GME) stock news
The Wall Street Journal reported last week that GameStop was hiring people for a cryptocurrency and NFT division. These are the meme stock spin-offs that have seen huge growth and appreciation in 2021, so it makes sense to attract some of that momentum back into the stock. Is this a clever strategy or a bit of attention-grabbing? Well, the results will speak for themselves, but the stock does need a catalyst. The holiday sales period will be key, but results are not due for a few months, so another catalyst is needed.
GameStop (GME) stock forecast
The spike last week from the above-mentioned pivot into crypto and NFTs failed to dent the channel. GME stock failed to make a new high and instead set a new low on Monday. This then looks like a classic downtrend.
Breaking $160 and closing above is the key pivot for restarting a bullish move. So long as GME trades below $160, then it is likely to target new lows below $118. There is a really big gap below. Obviously, $100 will prove psychological support, but volume is light until $60. We have a declining Relative Strength Index (RSI) and Moving Average Convergence Divergence (MACD) confirming the price trend. $160 is the short-term pivot with $167 the preferred resistance to hold above. That will see a test of the 200-day moving average at $185.
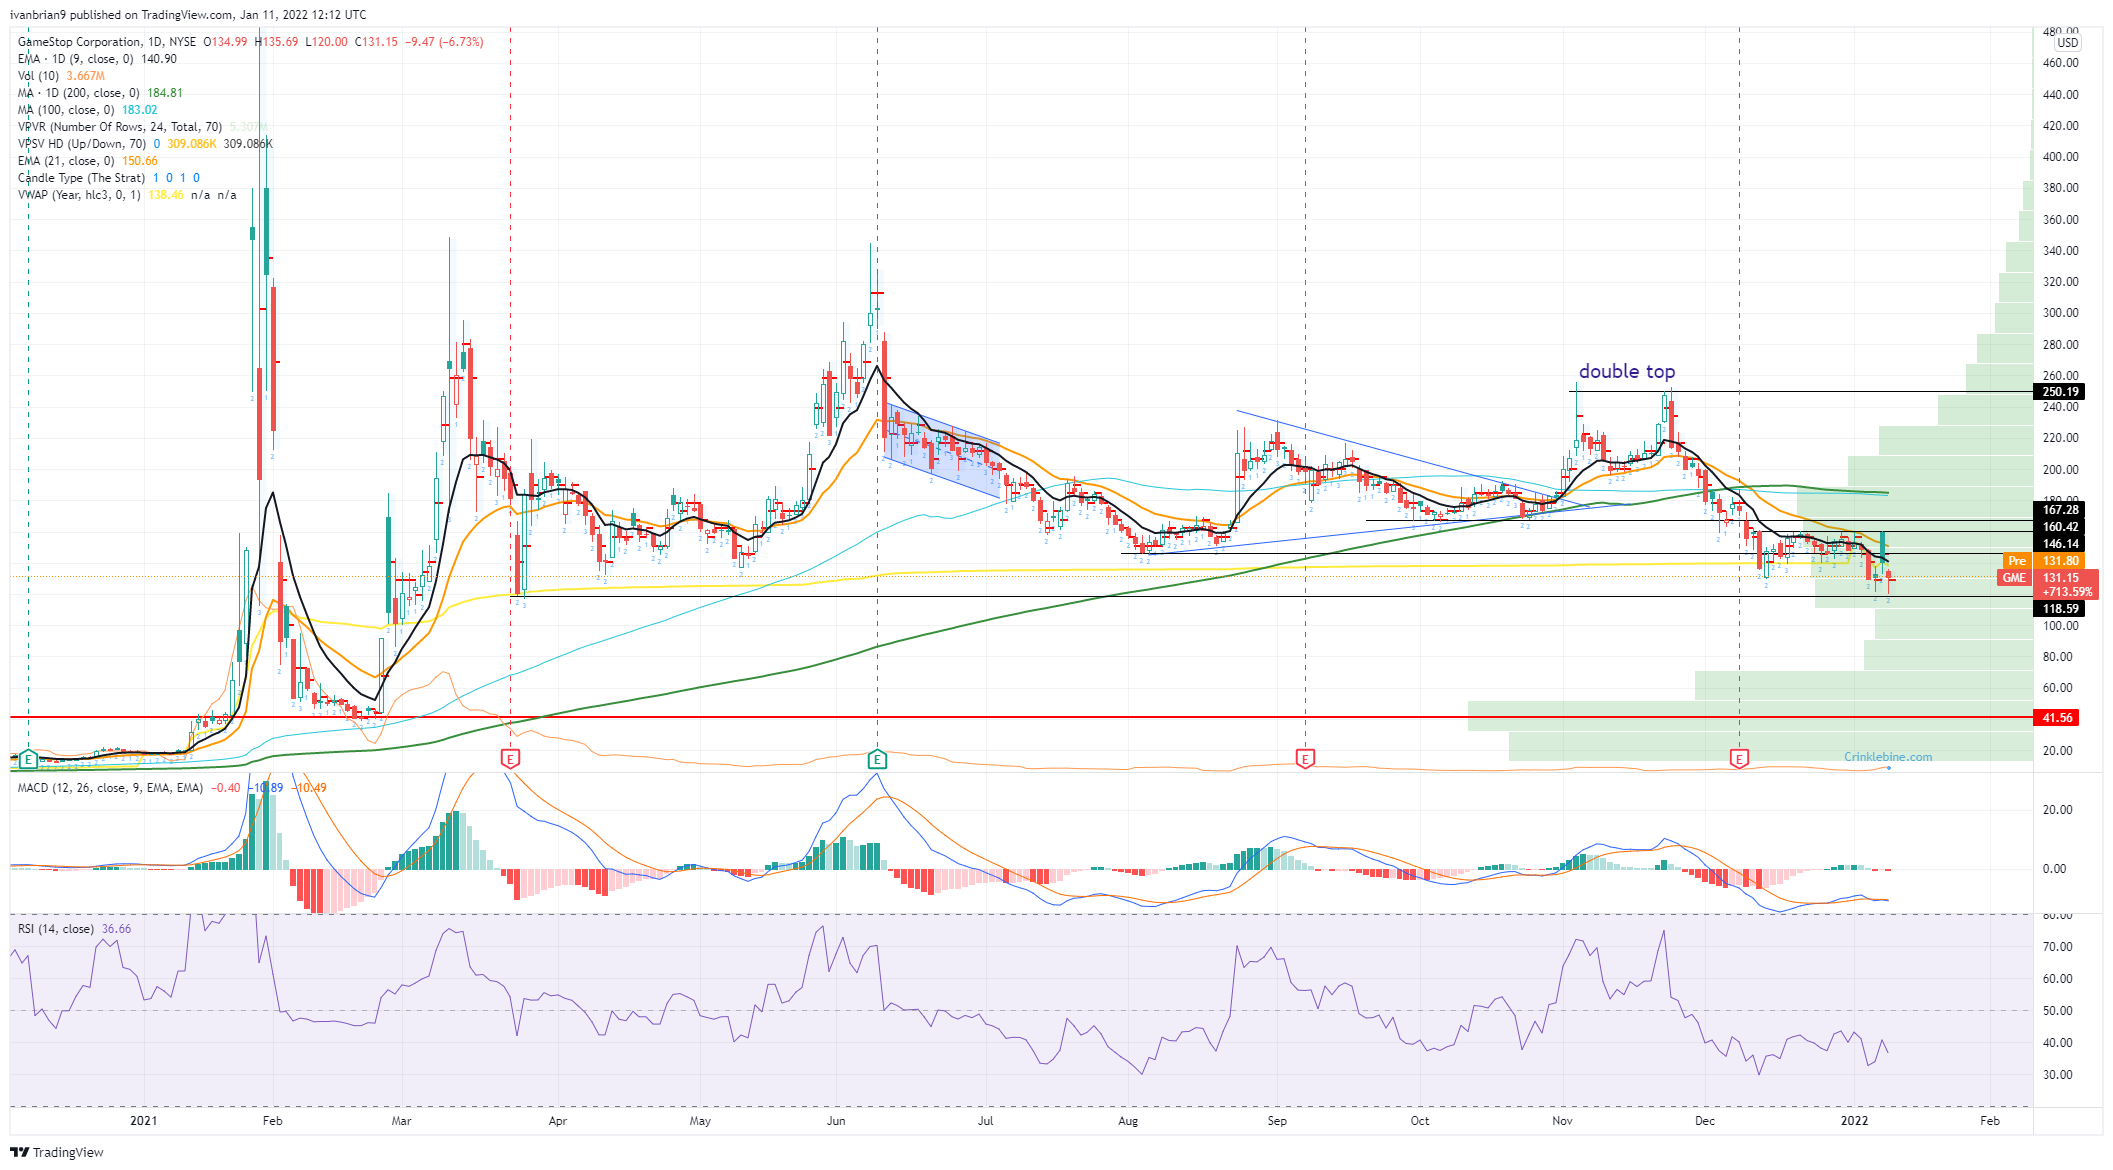
GameStop (GME) chart, daily
Like this article? Help us with some feedback by answering this survey:
Premium
You have reached your limit of 3 free articles for this month.
Start your subscription and get access to all our original articles.
Author

Ivan Brian
FXStreet
Ivan Brian started his career with AIB Bank in corporate finance and then worked for seven years at Baxter. He started as a macro analyst before becoming Head of Research and then CFO.


