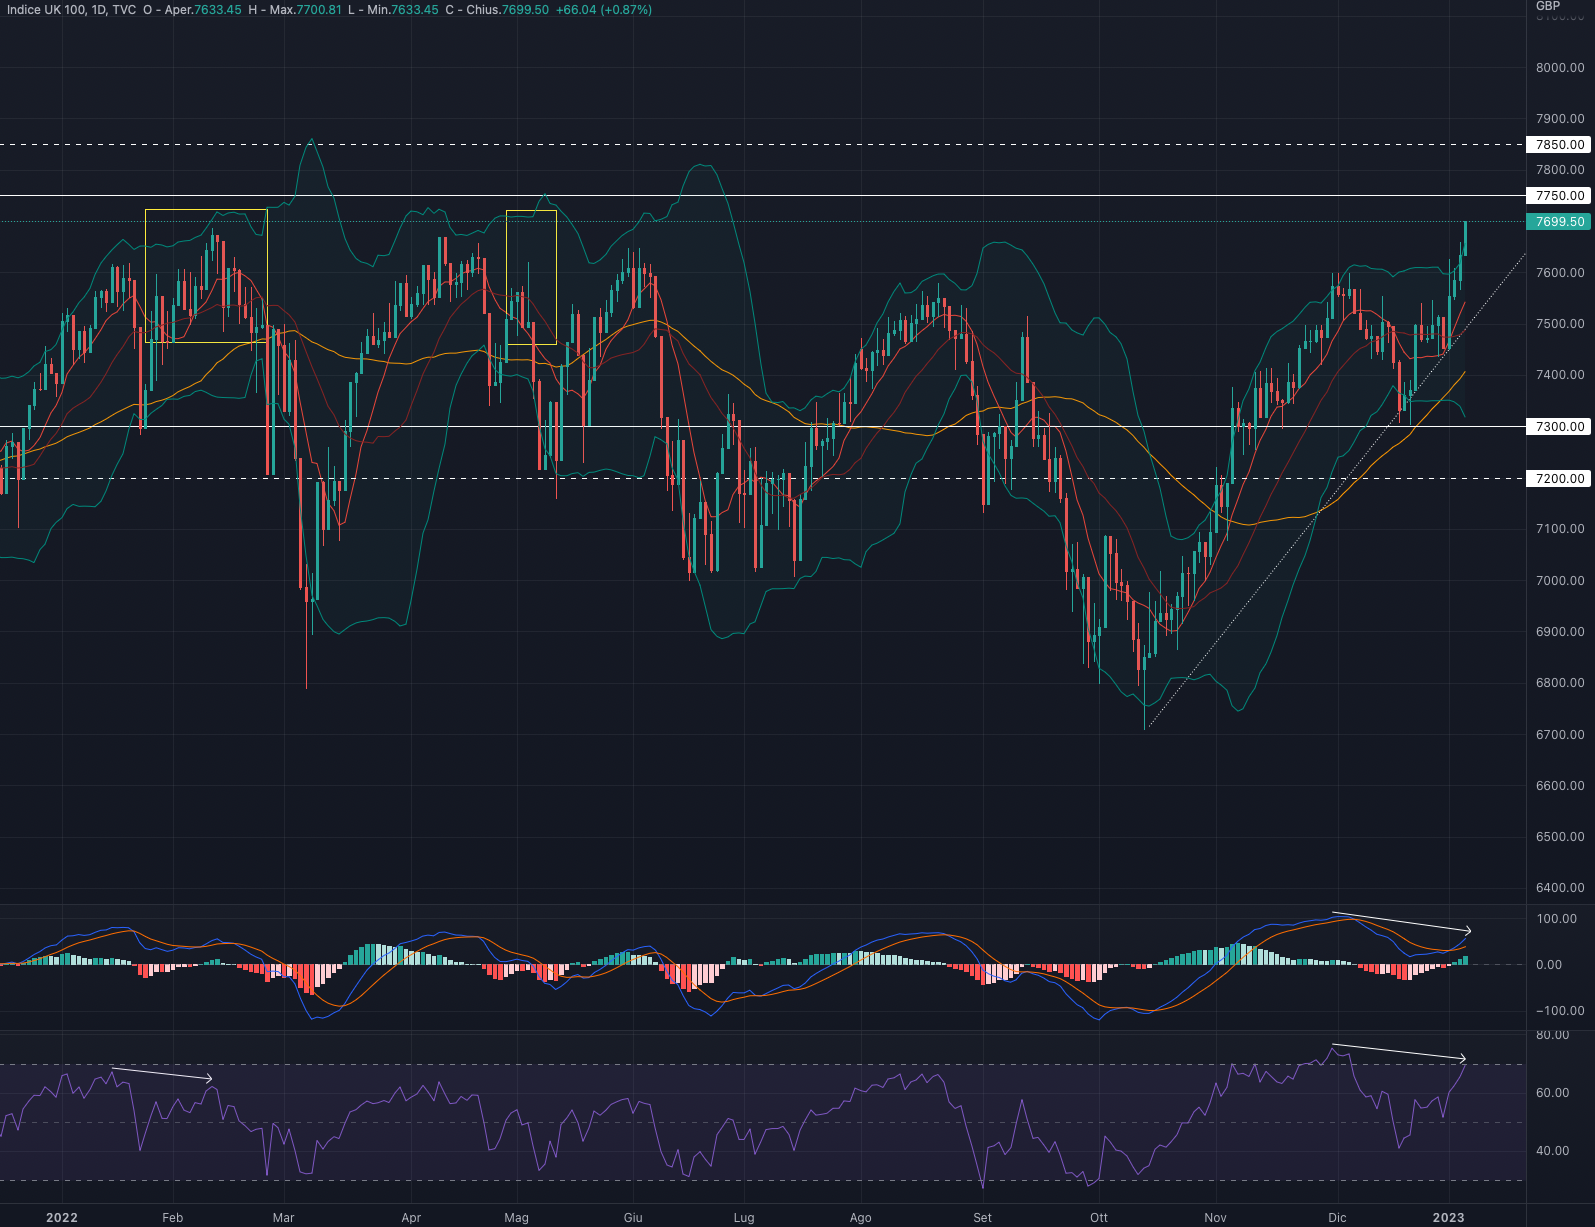
FTSE 100: The area of 7,000-7,750 represents a strong resistance

FTSE 100 (UKX)
| Current price | Forecast | S1 | R1 | S2 | R2 |
| 7,699 | Cons./Bearish | 7,300 | 7,750 | 7,200 | 7,850 |
The FTSE100 index had a week up by +3.32%.
For the week ahead we are in favour of a possible retracement to the 7,500 area.
Indicators
Very positive week for the British index which returns to the 2022 highs'.
The area of 7,000-7,750 represents a strong resistance that has never been overcome and we believe that even in this case there is not the necessary strength to proceed further upwards. Has happened before, a move up is usually proceed by a retracement first.
MACD and RSI are both very extended to the upside with the latter in overbought territory and negative divergence with the price action.
The price action regularity during 2022 we believe to be a strong direction indicator for the index and we reiterate that risk/reward is now in favour of possible market reversals. In addition, the exit from the Bollinger bands keeps us even more defensive for the week ahead
We remain bearish on the FTSE 100 and await a sizeable market reversal.
Support at 7,300.
Resistance at 7,750.
FTSEMIB (FTSEMIB)
| Current price | Forecast | S1 | R1 | S2 | R2 |
| 25,180 | Consolidation | 25,500 | 25,500 | 22,000 | 26,200 |
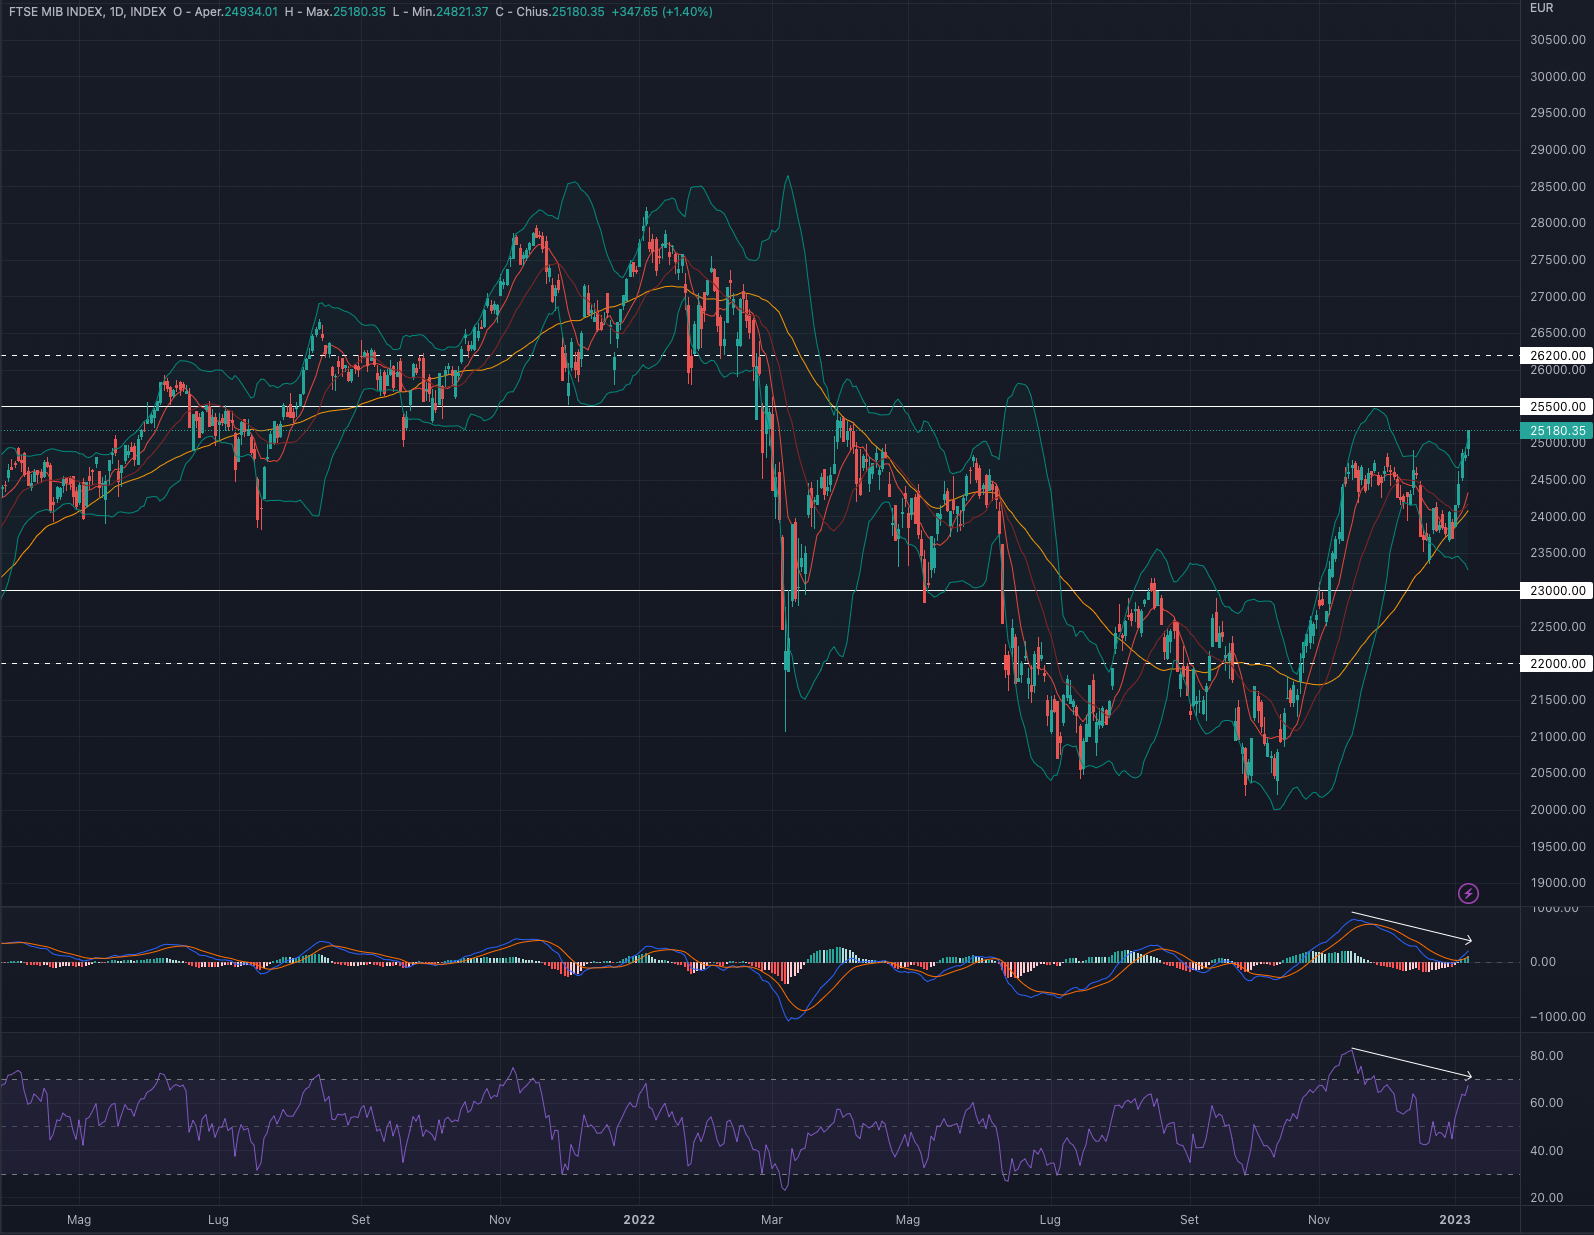
The FTSEMIB index had a week up by +6.22%.
For the week ahead we are in favour of a consolidation in the 24,400 area.
Indicators
Very positive week for the Italian index which returns to the March 2022 levels'.
As happened before, the resistance at 25,500 we believe is very difficult to overcome and in a context of strong extension we do not believe the necessary conditions are in place to continue upwards.
MACD and RSI are both quite extended to the upside and diverge negatively with the price move.
Risk/reward continues to be skewed to the downside, without excluding brief upswings.
We remain bearish on the FTSEMIB: the strong extensions of the week just concluded could represent one last push before more strong market reversals. A retracement to the 23,000 area could be very attractive for long setups.
Support at 23,000.
Resistance at 25,500.
DAX 40 (DAX)
| Current price | Forecast | S1 | R1 | S2 | R2 |
| 14,610 | Consolidation | 13,400 | 14,650 | 13,000 | 15,000 |
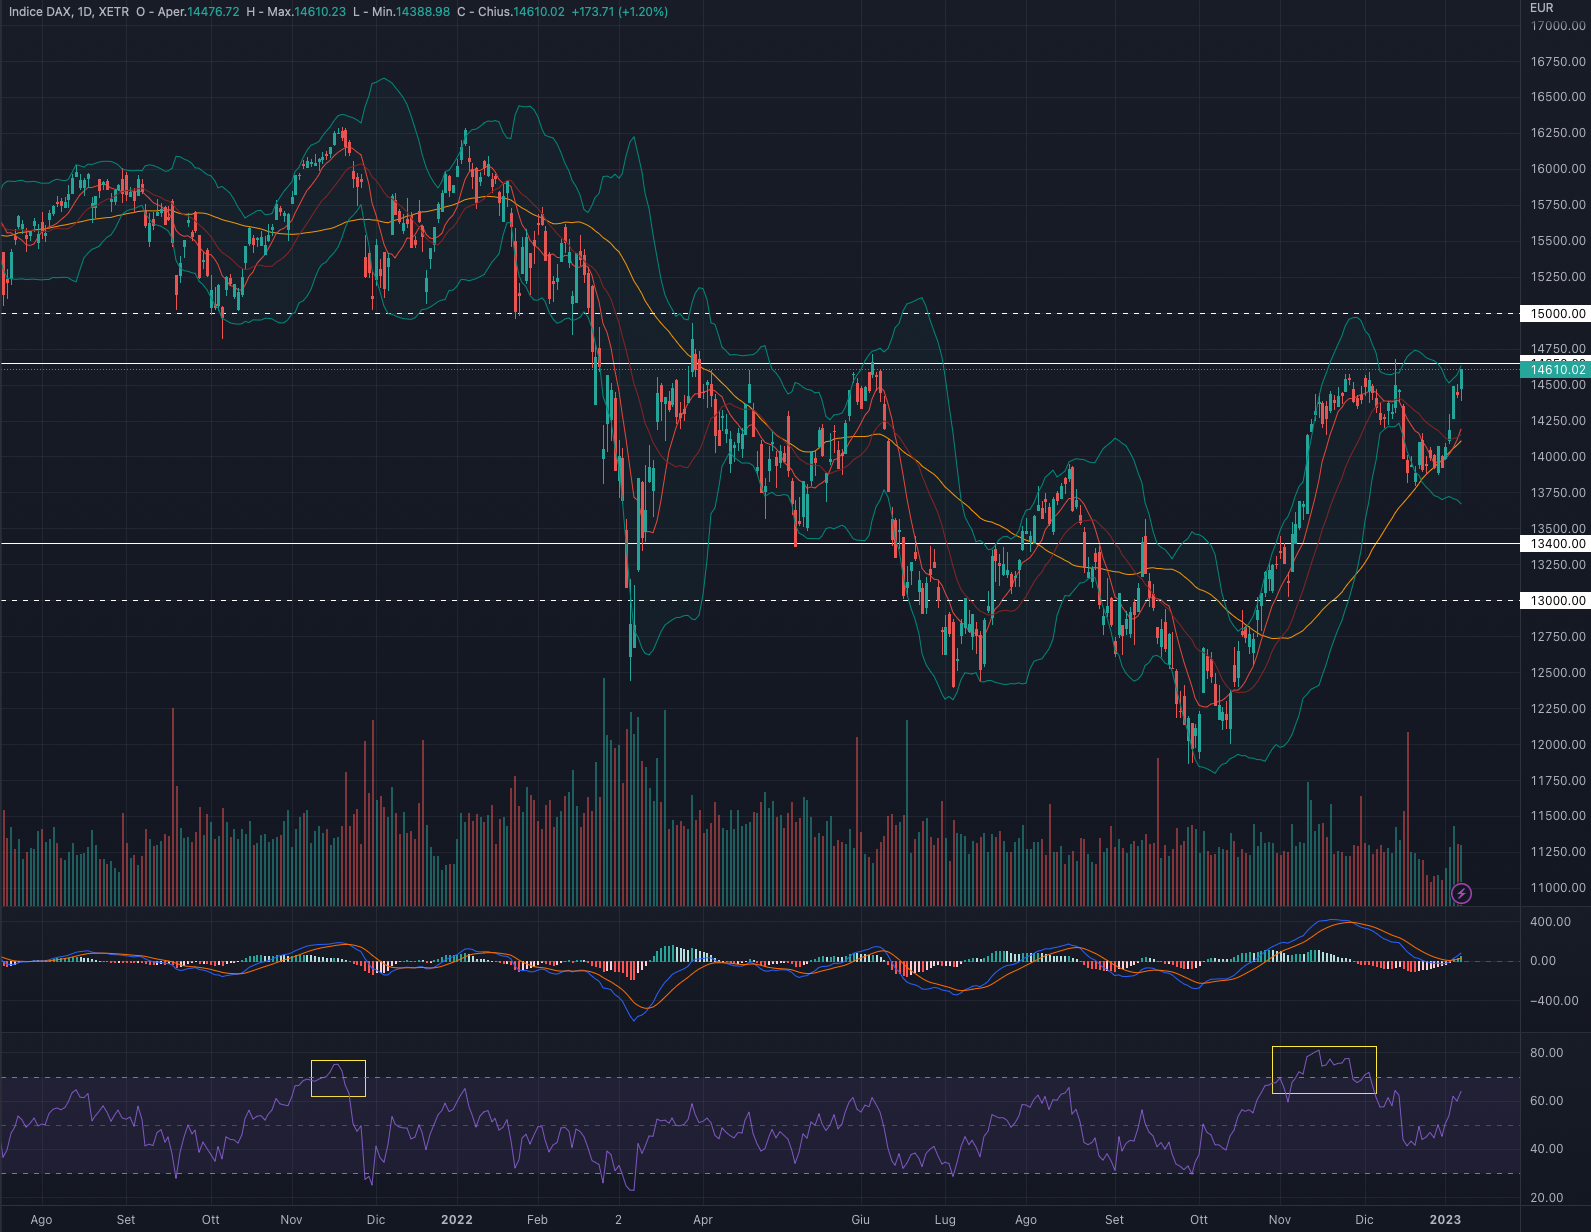
The DAX index had a week up by +4.93%.
We are in favour of a consolidation in the 14,400 area for the week ahead.
Indicators
Positive week that brings the German index back into the strong resistance level, which we believe could once again represent a strong barrier to overcome.
MACD and RSI after a bearish phase now seem ready to support any upside moves in the index even if very close to the overbought zone and in negative divergence with the price action.
In the very short term, the German index could give rise to bullish swings.However, we believe the surrounding scenario is very fragile with strong probabilities of declines rather than repeated upward moves.
We remain bearish on the DAX and await possible market reversals.
Support at 13,400.
Resistance at 14,650.
S&P 500 (SPX)
| Current price | Forecast | S1 | R1 | S2 | R2 |
| 3,895 | Cons./Bullish | 3,750 | 4,100 | 3,600 | 4,180 |
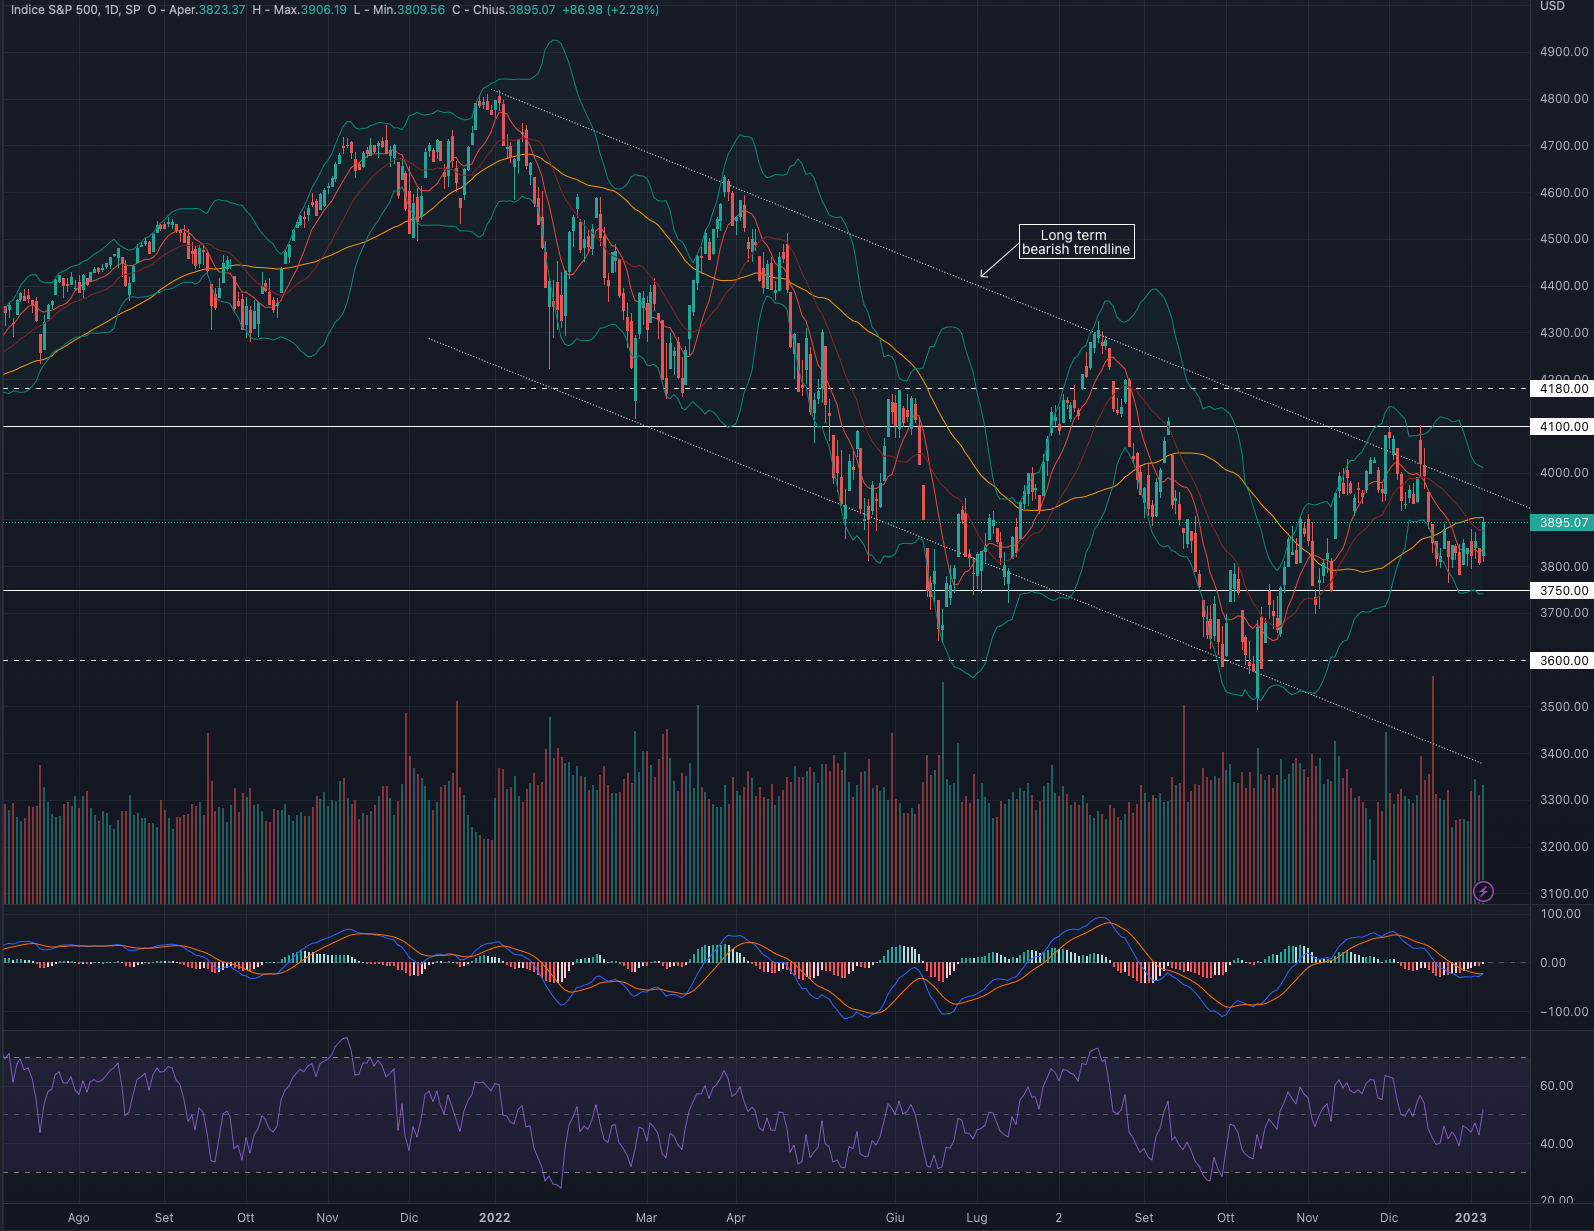
The S&P500 index had a week up by +1.45%.
For the week ahead we are in favour of a possible consolidation on the 3,900 area.
Indicators
Bullish week that sees the price now close to the 50-day average (yellow line).
The narrow trading range that started in mid-December seems to to be breaking to the upside, in the event of a positive opening for the coming week, we could look at a short-term target at 4,100.
Bearish scenario instead sees the price slide to 3,650.
MACD and RSI after a bearish phase could support the index in a short-term bullish phase.
We are bearish on the S&P 500, despite a possible recovery of strength we prefer to wait for further market retracements until at least 3,650.
Support at 3,750.
Resistance at 4,100.
Nasdaq 100 (NDX)
| Current price | Forecast | S1 | R1 | S2 | R2 |
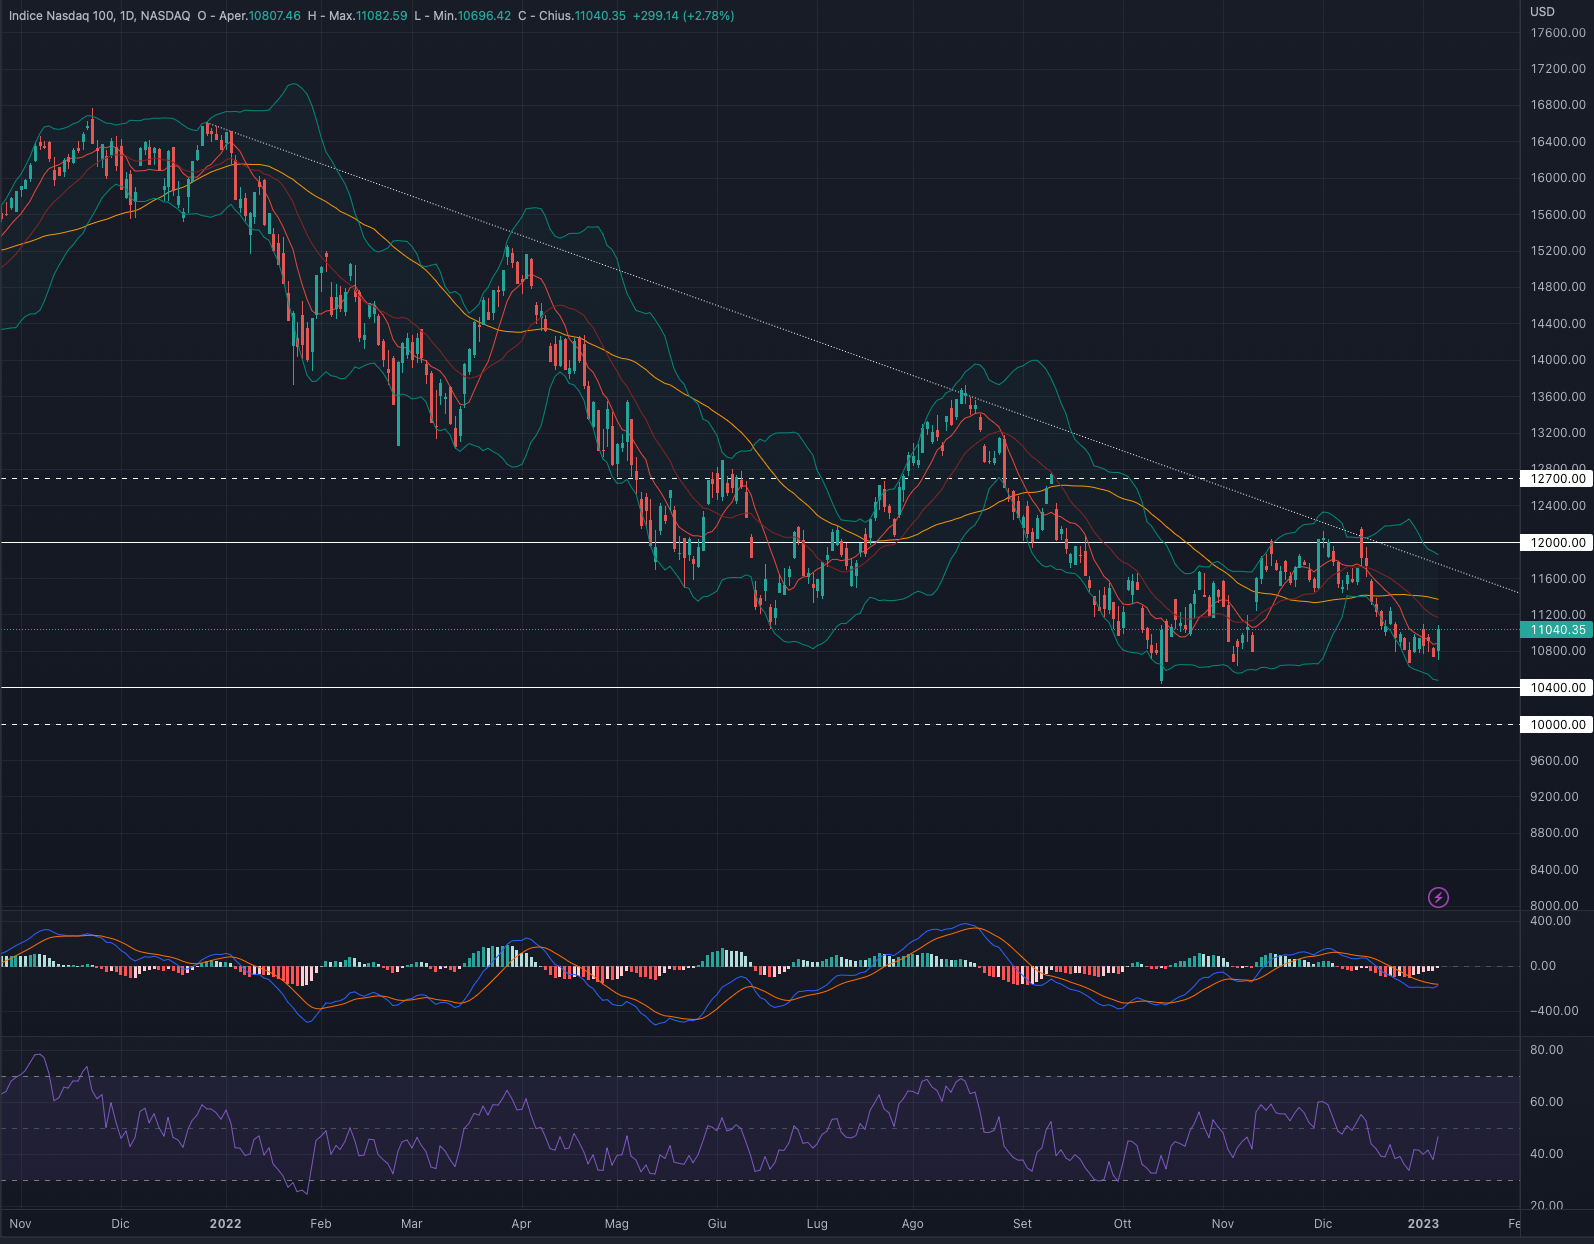
| 11,040 | Cons./Bullish | 10,400 | 12,000 | 10,000 | 12,700 |
The NASDAQ 100 index had a week up by +0.92%.
We are in favour of a possible move upward to 11,500 for the week ahead.
Indicators
Positive week for the Tech index which manages to stay above the October lows'.
The continuous swing close to the Bollinger band seems to suggest possible rises to at least 11,500.
MACD and RSI after a bearish phase now seem to lean towards positive swings, especially look at the RSI which has now reversed to the upside.
We are bullish on the NASDAQ 100 in the short term: the break above the 5-day average (red line) seems to suggest a slight recovery of vigour for then.
Support at 10,400.
Resistance at 12,000.
Dow Jones (DJI)
| Current price | Forecast | S1 | R1 | S2 | R2 |
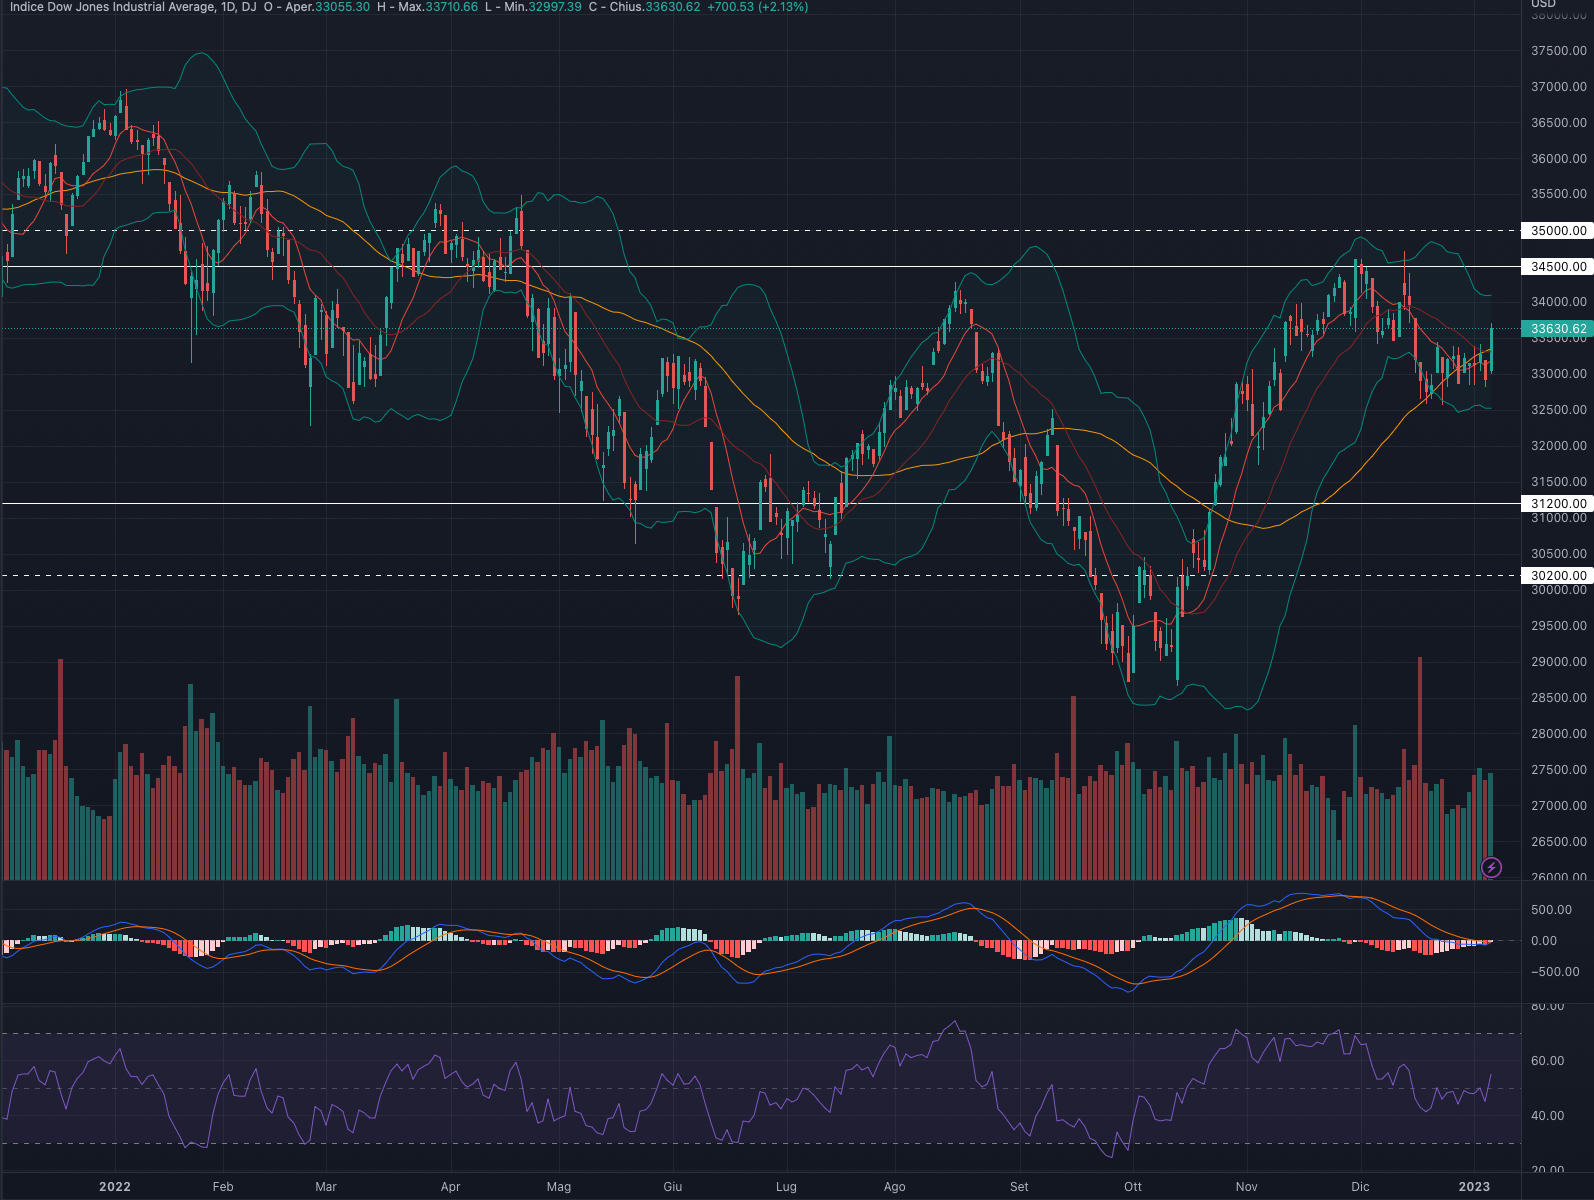
| 33,630 | Cons./Bullish | 31,200 | 34,500 | 30,200 | 35,000 |
The DOW JONES index had a week up by +1.46%.
For the week ahead we are in favour of a further leg upward to 3,400-3,500.
Indicators
Positive week that saw the price exiting the narrow trading range started in mid-December.
We believe a plausible scenario would be to back-test the previous consolidation area at 34,000 and then continue lower.
MACD and RSI seem to be favouring a slight recovery for now.
Despite a possibile short term bullish scenario, we remain bearish on the DOW JONES over the medium term and until the price reaches at least 31,600 the risk return will remain skewed in favor of further downsides.
Support at 31,200.
Resistance at 34,500.
TADAWUL (TASI)
| Current price | Forecast | S1 | R1 | S2 | R2 |
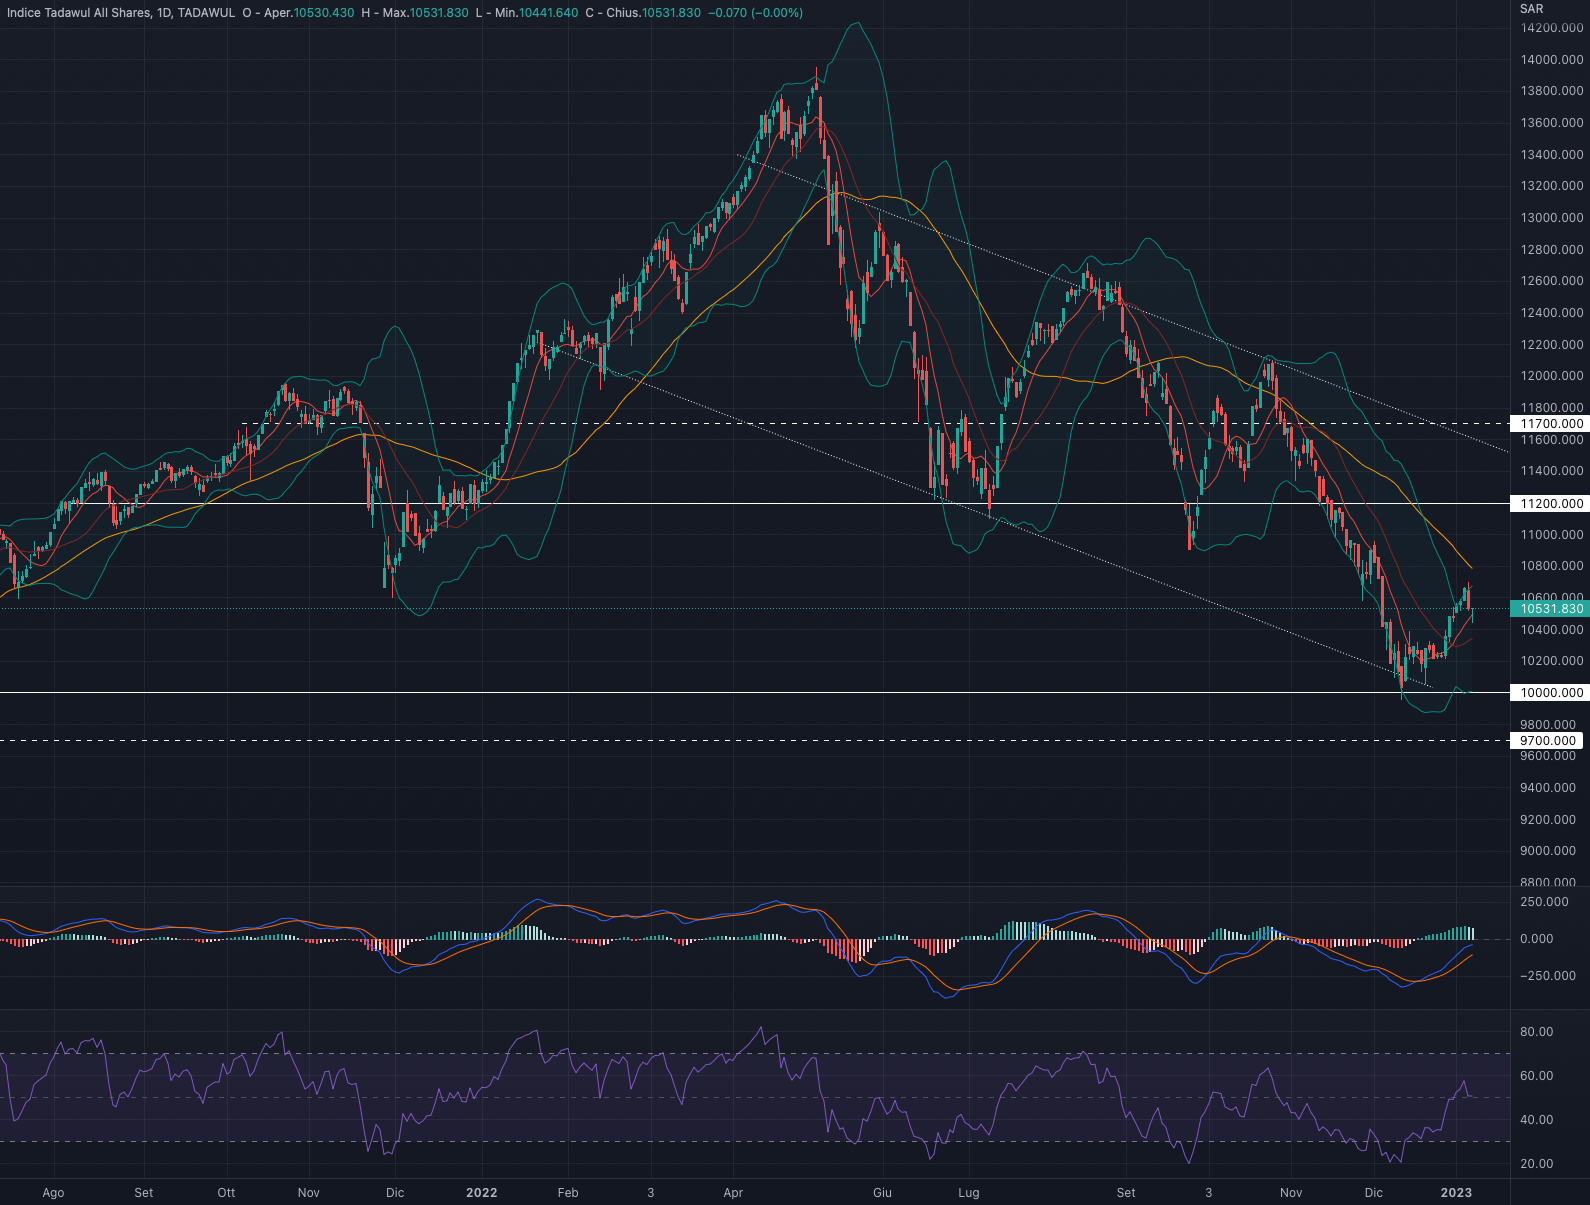
| 10,531 | Cons./Bullish | 10,000 | 11,200 | 9,700 | 11,700 |
TADAWUL index had a week up by +2.57%.
We are in favour of a recovery to at least SAR 10,750 for the week ahead.
Indicators
Positive week for the Saudi index which seems to want to start an upward reversal
As happened in November 2021, the strong distance from the 50-day average (yellow line) could suggest a possible short-term recovery. At the same time it is important to stress that the first obstacle to overcome remains the 9-day average (red line), which has played the role of dynamic resistance in recent months
MACD and RSI are in oversold territory, decreasing the possibility of further short-term downside. Both indicators have started a slight reversal to the upside.
At the moment we prefer to remain neutral on the Tadawul. The strong downside extension makes today's swings very interesting, at the same time we believe it is worth waiting for a consolidation followed by price reversal above at least the 10,550 - 10,600 level.
Support at 10,000.
Resistance at 11,200.
FTSE ADX GROWTH MARKET INDEX (FADGI)
| Current price | Forecast | S1 | R1 | S2 | R2 |
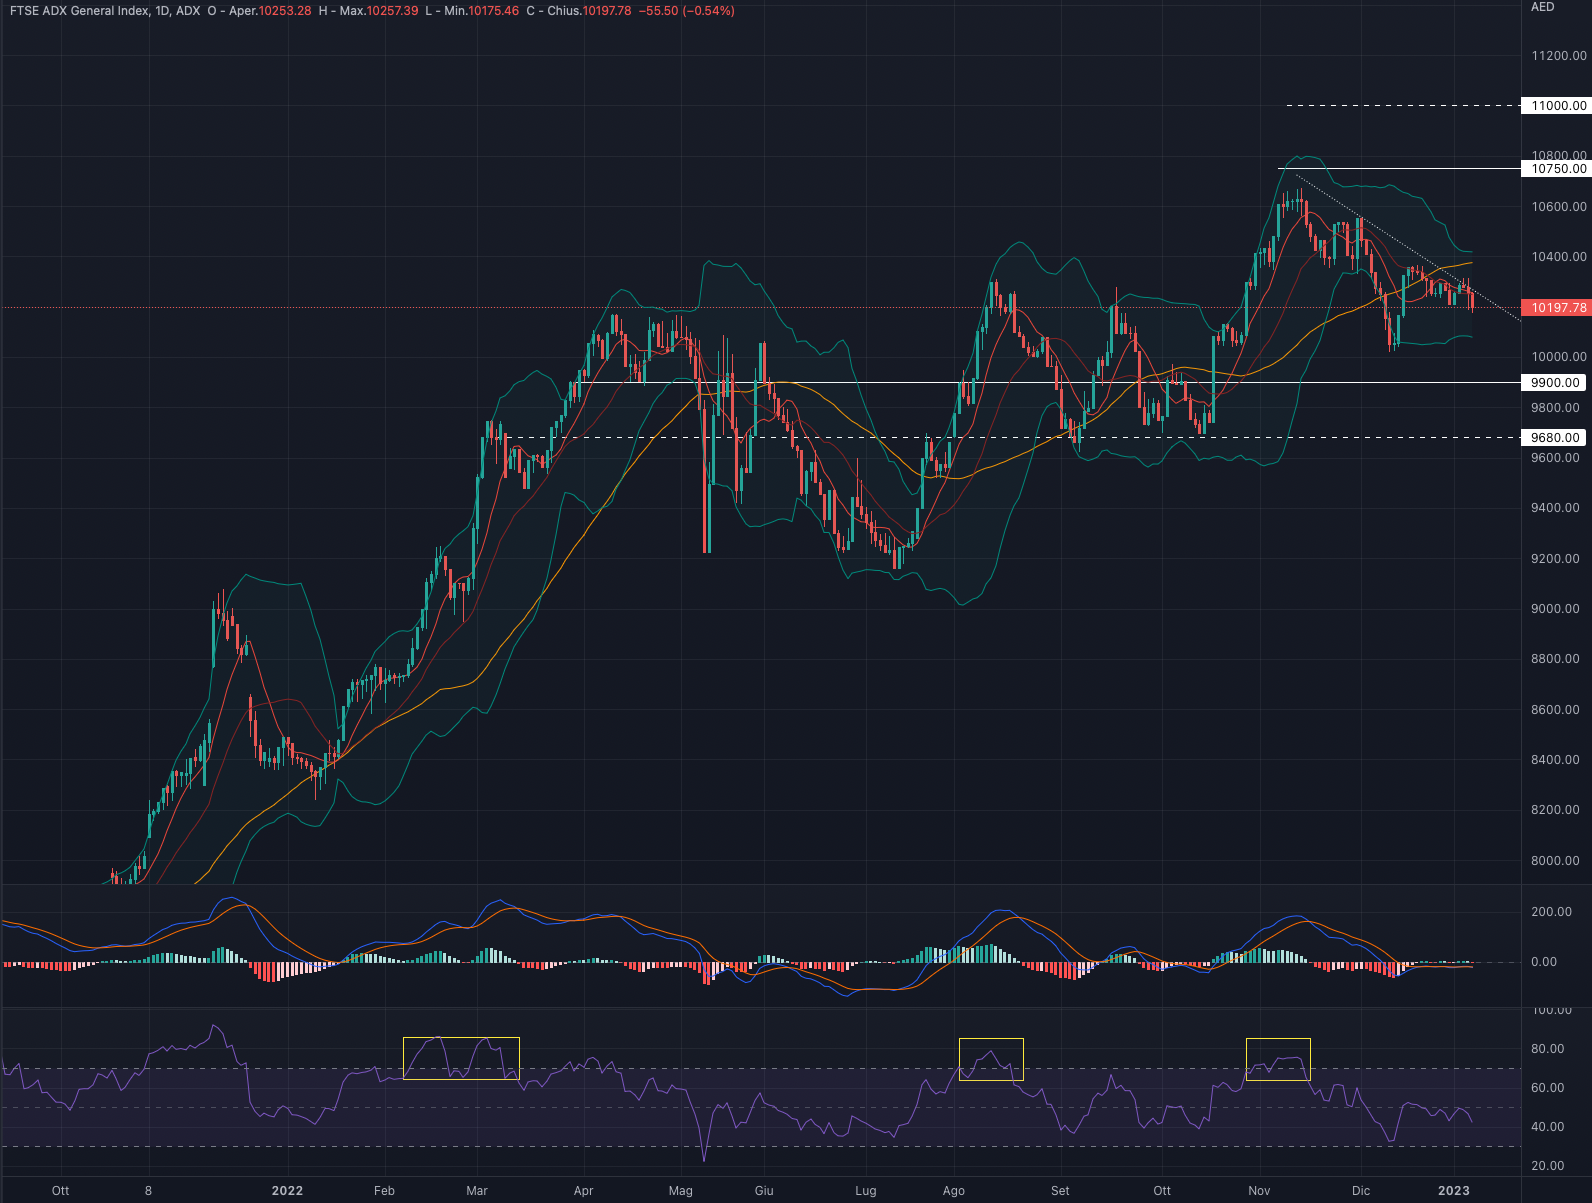
| 10,197 | Consolidation | 9,900 | 10,750 | 9,680 | 11,000 |
FTSE ADX index had a week down by -0.13%.
For the week ahead we favour a consolidation in the 10,000-10,400 area.
Indicators
A week of slight declines which sees the price respecting the bearish trendline that began in December
Continued swings near the 50-day average (yellow line) could pave the way for a re-test of 10,600.
MACD and RSI mirror the price action and are both very close to going back into bullish territory.
Specifically, we prefer to wait for a consolidation in the 10,000 -10,400 area and then consider long setups: even a possible retracement to 9,900 could offer interesting opportunities.
We currently remain neutral on the FTSE ADX with a short-term upside bias.
Support at 9,900.
Resistance at 10,750.
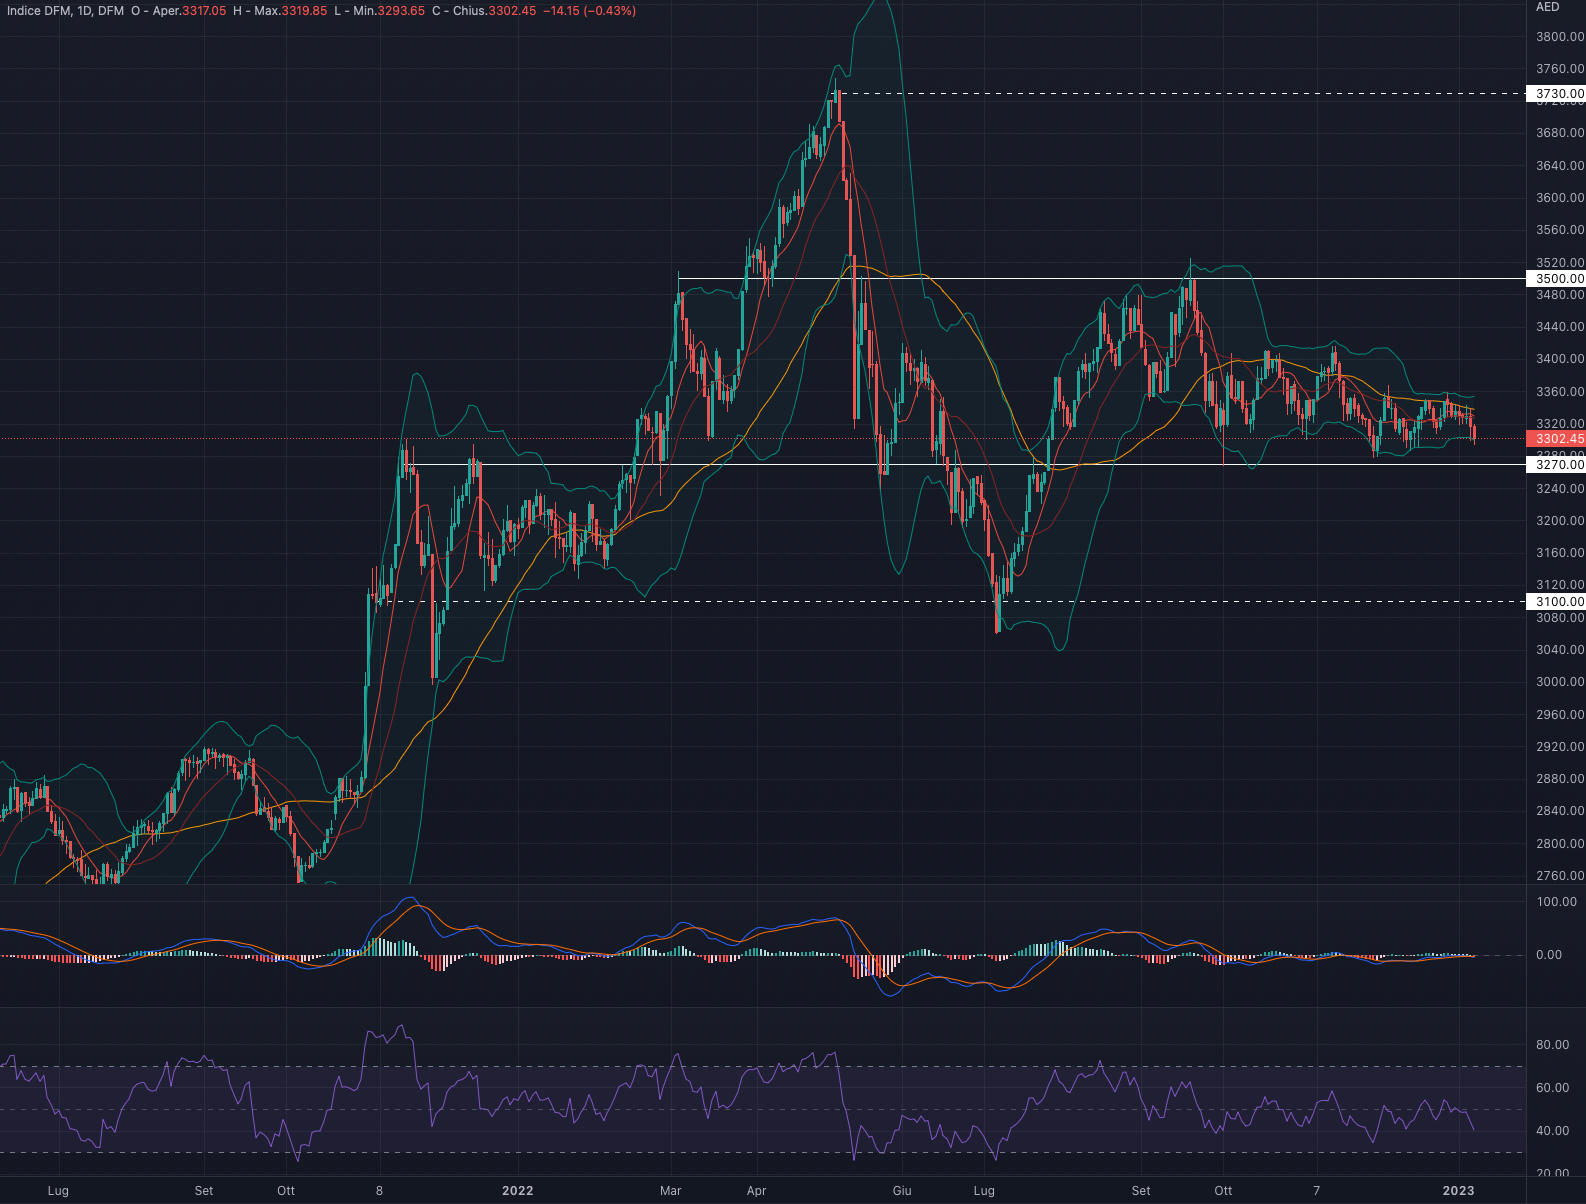
DUBAI FINANCIAL MARKET GENERAL INDEX (DFMGI)
| Current price | Forecast | S1 | R1 | S2 | R2 |
| 3,302 | Cons./Bullish | 3,270 | 3,500 | 9,700 | 11,700 |
DFM index had a week down by -1.01%.
For the week ahead we are in favour of a possible recovery to 3,380.
Indicators
A week of substantial consolidation for the DFM.
Since mid-September, the index has continued to fluctuate within the same trading range of 3,300-3,400, giving no particular direction in the short to medium term.
MACD and RSI are also neutral with the latter slipping into bearish territory.
We currently remain neutral on DFMGI waiting for a break of one of the two levels at 3,300 or 3,400
Support at 3,270.
Resistance at 3,500.
Author

Francesco Bergamini
OTB Global Investments
Francesco, BSc Finance and Msc in Business Management, graduated with Merit, is a professional with experience in the financial services industry and a keen interest in the financial markets.


