Farfetch Limited Stock Forecast: After market dumps FTCH 35%, can the fashion marketplace be resurrected?
- Farfetch stock has gained 3.5% in Friday's premarket.
- This semi-rally comes one day after FTCH stock dropped 35%.
- On Thursday management disclosed a poor outlook.
- Robust nonfarm payrolls data has pushed the NASDAQ down 2%.
.jpg)
Farfetch (FTCH) stock is surprisingly being bought up just a day after shares of the online fashion marketplace collapsed 35% on poor guidance. Friday's premarket has allowed value investors to add shares, boosting the price 3.5% to $5.71. This is even more surprising since November's nonfarm payrolls data was released at 8:30am EST, showing that employment continues to chug right along with wage growth. NASDAQ futures dropped more than 2% on the release.
Farfetch stock news: NASDAQ cannot faze FTCH
Wall Street had expected 200,000 new job hirings as part of November's nonfarm payrolls data. October had reported 284,000, but analysts were expecting a larger slowdown due to recent inflation readings beginning to drop. Instead November saw 263,000 new jobs, meaning the economy remains quite robust. Weaker hiring would have left the market more certain that the Federal Reserve could more quickly shift to slowing its interest rate hikes, which have had a devastating effect on equity prices. To add insult to injury, average hourly rose higher than October to 5.1% YoY, well ahead of consensus at 4.6%. Competinent observers know that the Fed takes rising wages quite seriously when determining inflation's near-term direction.
Farfetch stock, however, appears to be reacting to Thursday's catastrophic sell-off. It all began when management filed an update with the Securities & Exchange Commission (SEC). A quick scan of the filing would not seem worrying, but the executive team's forecast for platform margins and gross merchandise value meant that the extreme growth shareholders were hoping for was not imminent. Those wild expectations for growth were what sent FTCH stock up to nearly $74 a share back in February 2021.
Management now sees gross merchandise value in fiscal year 2023 rising to $4.9 billion, a 20% to 22% expansion. However, this growth rate is made up of just 8% to 10% organic growth, coupled with about $500 million in gross merchandise value from new partnerships. The organic growth is just not that exciting for the market. Additionally, adjusted EBITDA for fiscal 2023 was forecast at between 1% and 3%, which does not leave room for profits. In this era of higher interest rates, delaying profits leaves equities with reduced discounted values.
From there managment expects gross merchandise value to expand to $10 billion in fiscal year 2025. This would put adjusted revenue somewhere around $3.5 billion, and profits would likely remain quite miniscule. All told this is not the exciting opportunity that founder and CEO Jose Neves sold to the public two years ago. Back on November 17 Farfetch announced quarterly earnings that missed on both the top and bottom lines.
Farfetch stock forecast
Farfetch stock has lost about 84% of its value year to date. This places it in the camp of growth stocks that have completely lost the narrative. Other forgetable names like Upstart (UPST) come to mind.
Below readers will notice the long red daily candle on the far right of the daily chart. That is bad (wink, wink). From a technical perspective, FTCH stock looks uninvestible. Most interested buyers on Friday morning, however, are probably thinking that buying Farfetch at a 30% discount to 2023 revenue seems like a decent bet. Wells Fargo just two weeks ago stuck to its guns after Farfetch missed consensus forecasts for quarterly earnings and revenue and retained its $25 price target.
In the short term bulls will focus on breaking above the demand zone between $7 and $7.30 (highlighted in light blue). From there the bullish challenge will be conquering the $8.50 resistance level and advancing to the $10.40 resistance. Above that latter level, the rest of the market will grow more confident and possibly enter the trade.
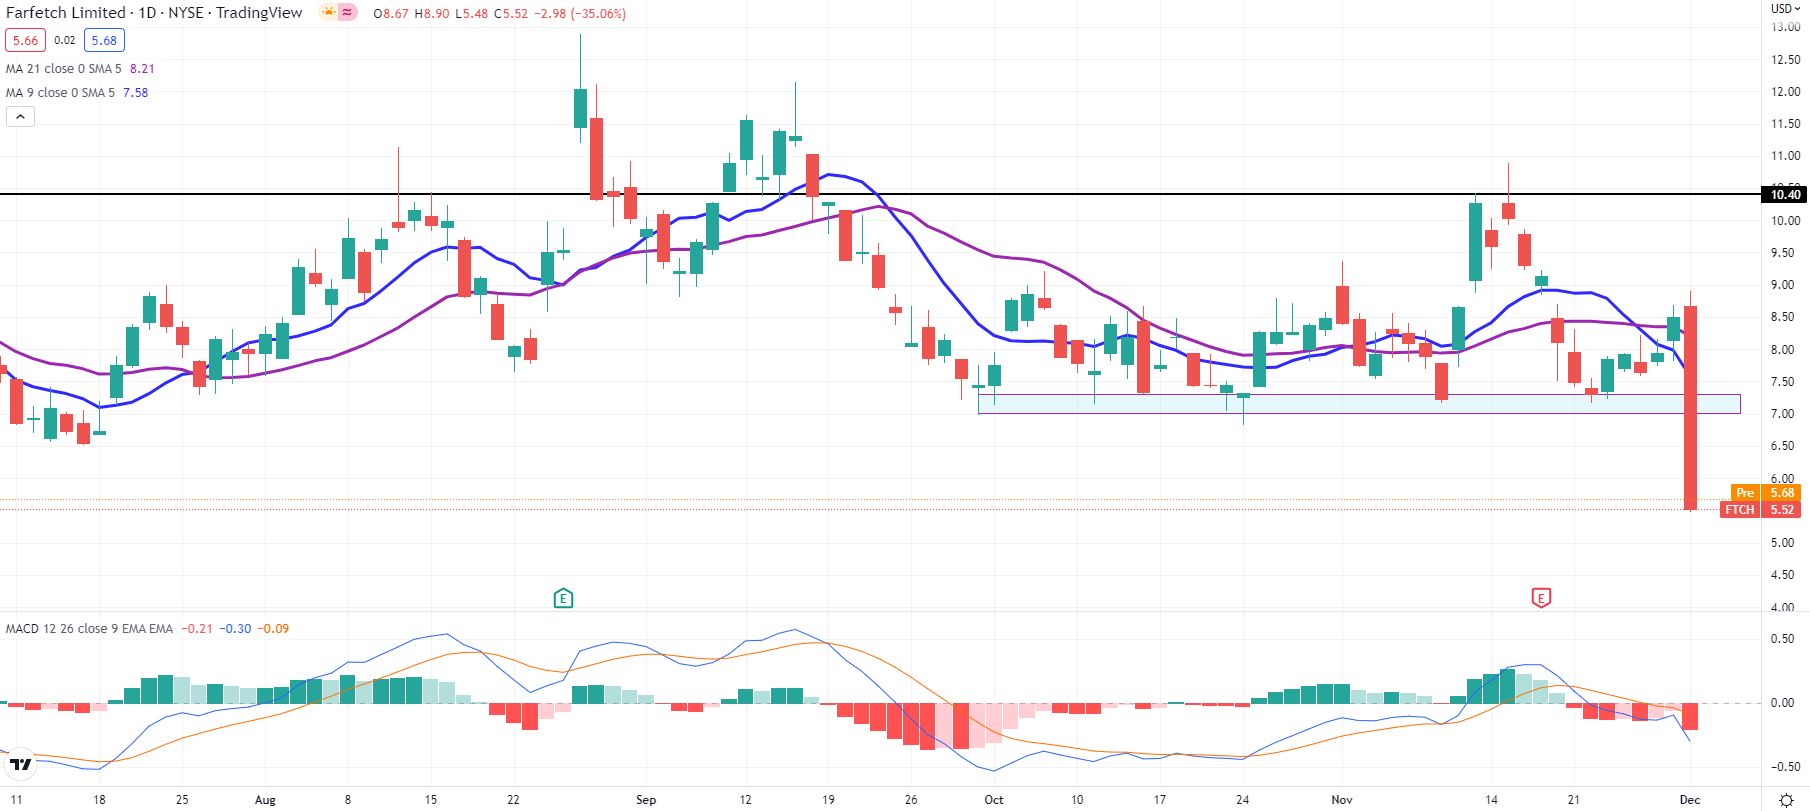
FTCH 1-day stock chart
Author

Clay Webster
FXStreet
Clay Webster grew up in the US outside Buffalo, New York and Lancaster, Pennsylvania. He began investing after college following the 2008 financial crisis.