FAANGTastic chart analysis: FB AAPL AMZN NFLX GOOGL TSLA key daily technical levels May 19
- Big tech suffers on Tuesday as Nasdaq and S&P 500 align.
- The crypto crash continues to hurt Tesla.
- AAPL and AMZN retarget 200-day moving averages.

Tuesday was another weak day for equities, and our FAANGT stocks duly followed suit. Tesla outperforms ending the day in positive territory as Michael Bury disclosed a big short.
Let us dig in and see if the charts hold any insight.
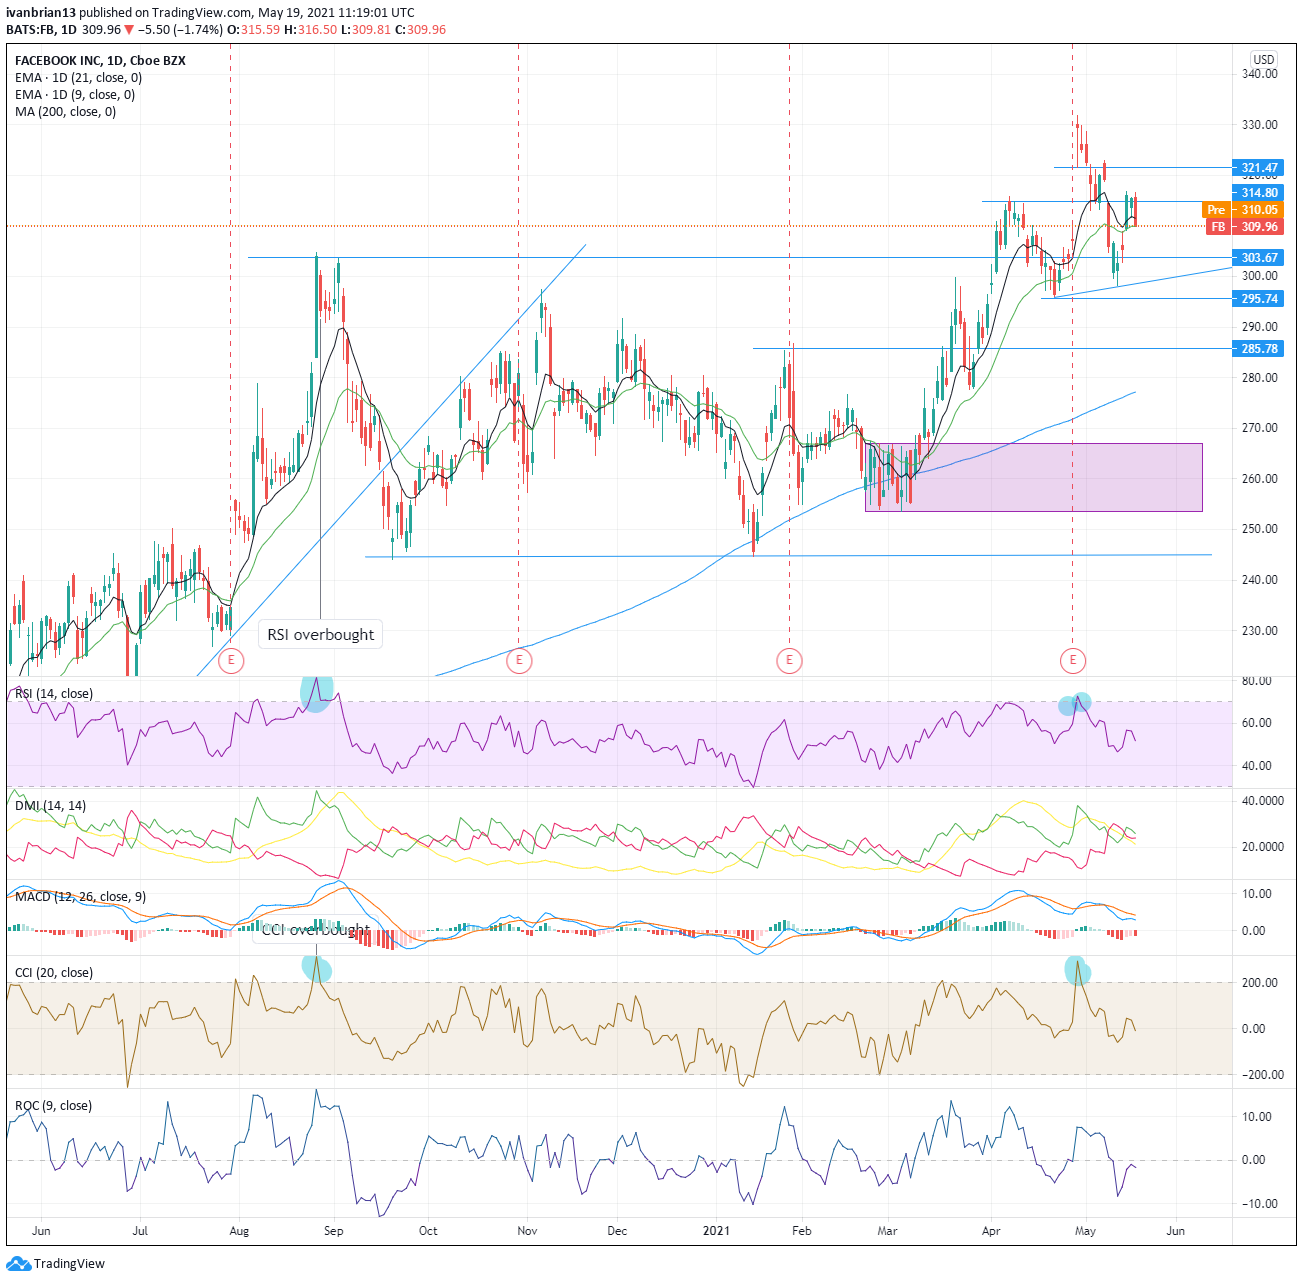
Facebook (FB) stock forecast
FB shares rallied up to resistance near $314.80 and again retraced. A sustained move above this is necessary and then a break of $321.47 should lead to fresh highs. The trend is very weak with 9 and 21-day averages flatlining and Relative Strength Index (RSI), Commodity Channel Index (CCI), and Rate of Change (ROC) all in neutral territory. No high conviction trades around current levels. A break of $321.47 or $295 is needed to restart any trend moves.
| Support | 310 | 298-296 | 285.78 | 277-200 day ma | 266-256 buy zone |
| Resistance | 315 | 321.47 | 331.81 |
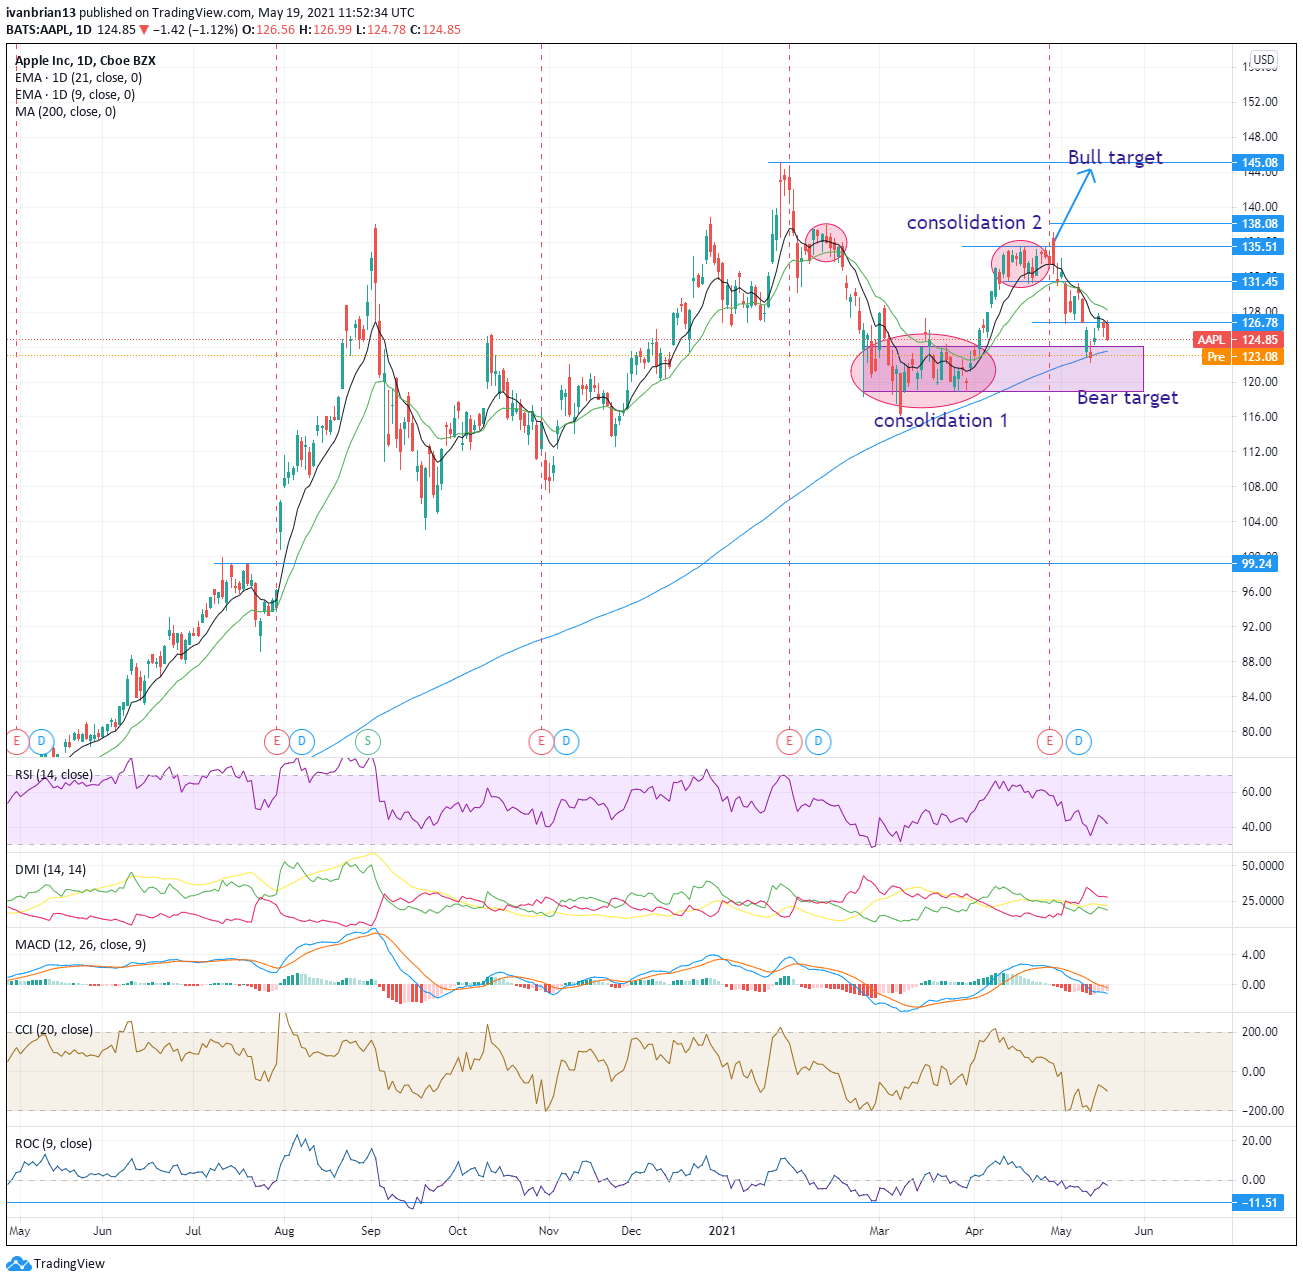
Apple (AAPL) stock forecast
Apple shares rallied up to the $126.78 resistance level on Monday before struggling on Tuesday. Previously, AAPL had tested its 200-day moving average and it looks likely to do so again as the week progresses. This is a strong support area with the consolidation phase from March and April acting as a confluence of support with the 200-day moving average. The main oscillators are all relatively neutral – RSI, CCI and ROC. All are trending with price confirming the current small and short-term downturn. Breaking $126.78 is the first step, but breaking $131.45 will bring this sideways range to an end and set the scene for renewed bullishness and a test of $135.51. Break this, and it is on for new highs.
| Support | 124 | 119 key | 11699.24 | ||
| Resistance | 126.78 pivot | 129.40 weak | 131.45 | 135.51 |
145.08 |
Amazon (AMZN) stock forecast
Amazon has been effectively stuck in a massive sideways range since Christmas, and nothing looks set to shake it just yet. The post-earnings top did look too stretched as RSI, CCI and ROC failed to make fresh highs to confirm the price high. AMZN shares are currently at a confluence of support levels from the trend line at $3,161 and 200-day moving average at $3,208. Breaking this should see a move to $2,883. A break of that and the next target is circa $2400, a strong support region. For now though, AMZN is neutral and not tempting for new positions. A break of $3,434 is needed for bullishness, a break of $3,161-$3,208 should see bears push AMZN lower.
| Support | 3142 key | 3080 | 2883 | 2500 | 2300 | 2000 |
| Resistance | 3240 9-day MA | 3268 | 3434 | 3555 |

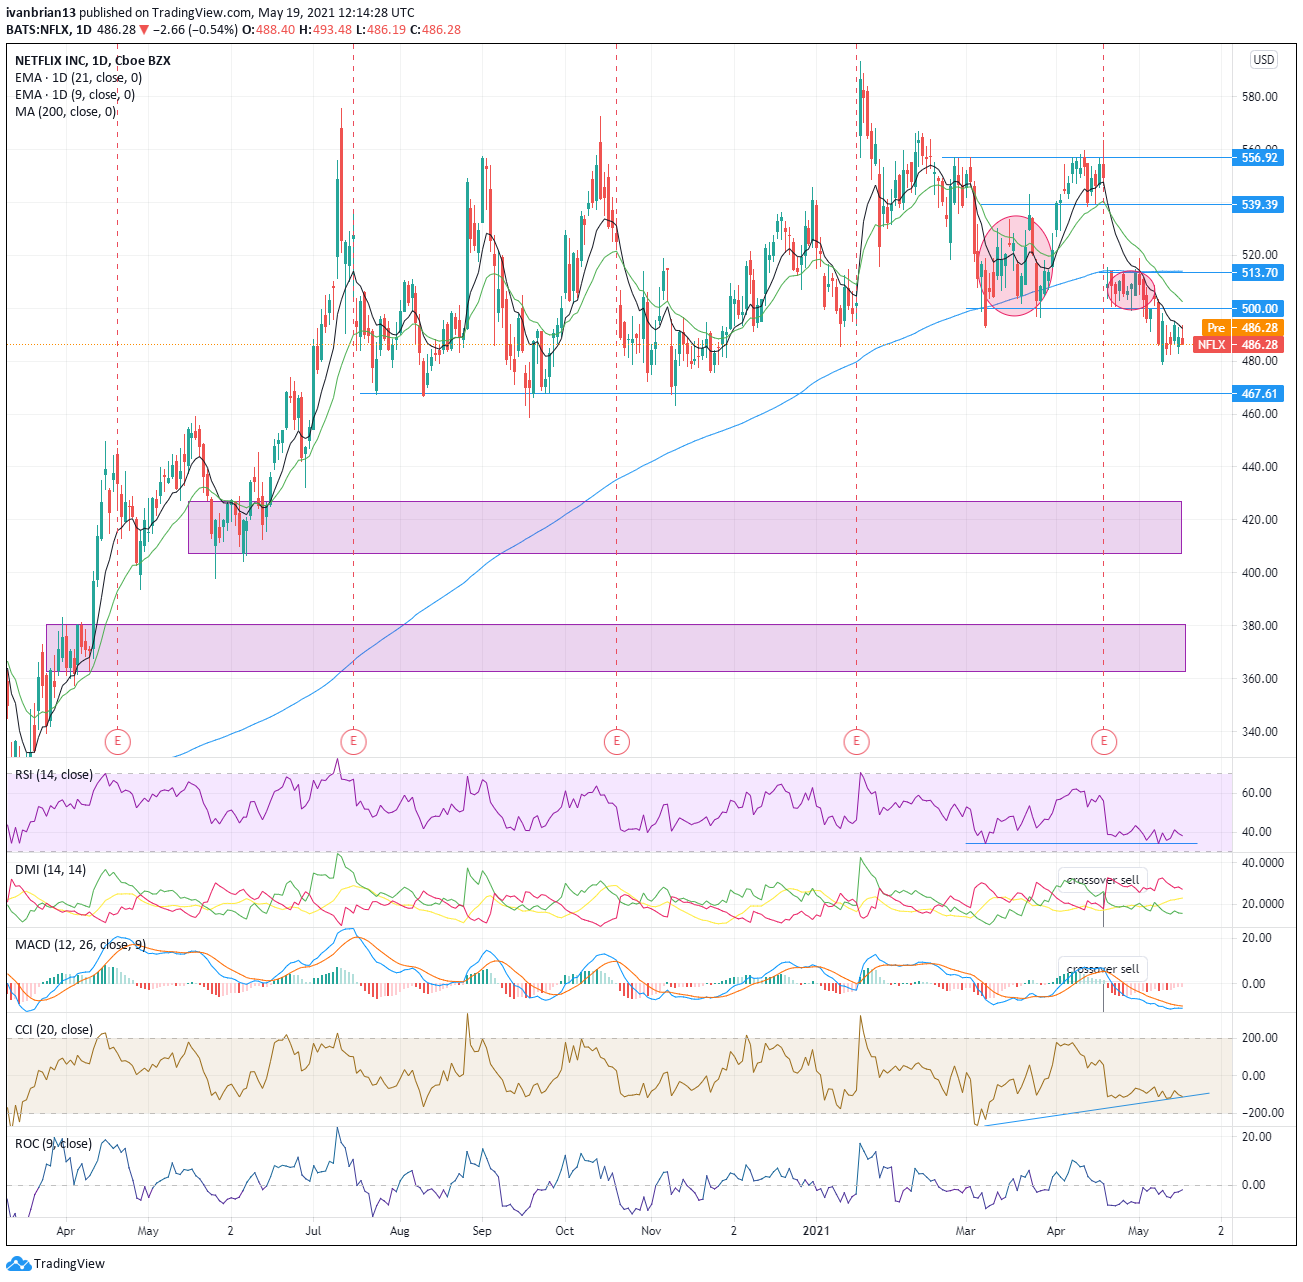
Netflix (NFLX) stock forecast
Disney's recent results and in particular subscriber numbers have added to Netflix woes. The stock was already under pressure, and now this adds to concerns over Netflix's own subscriber growth, which has slowed during the last fiscal quarter. $513.70 is the key level here. Hold below and NFLX is bearish. Break and the stock should fill the earnings gap up to $539. A small long might work for a pop to $500 as the RSI, CCI and ROC have diverged from the price. They are flat or trending higher, while the share price is still dropping, a bullish divergence. $500 is a reevaluation level. The MACD is also close to giving a crossover buy signal, further adding to the potential of a swing play. However, use a stop as always. A break of the 9-day moving average at $492 would give a little more confidence. But this, however, is not a high conviction trade.
A break of $467 will likely see a test of the $420 support region, which is highlighted.
| Support | 467 | 420 | 400 | 380 | 360 | |
| Resistance | 492 9-day | 500 | 514 200-day MA | 540 | 556.92 | 593.29 |
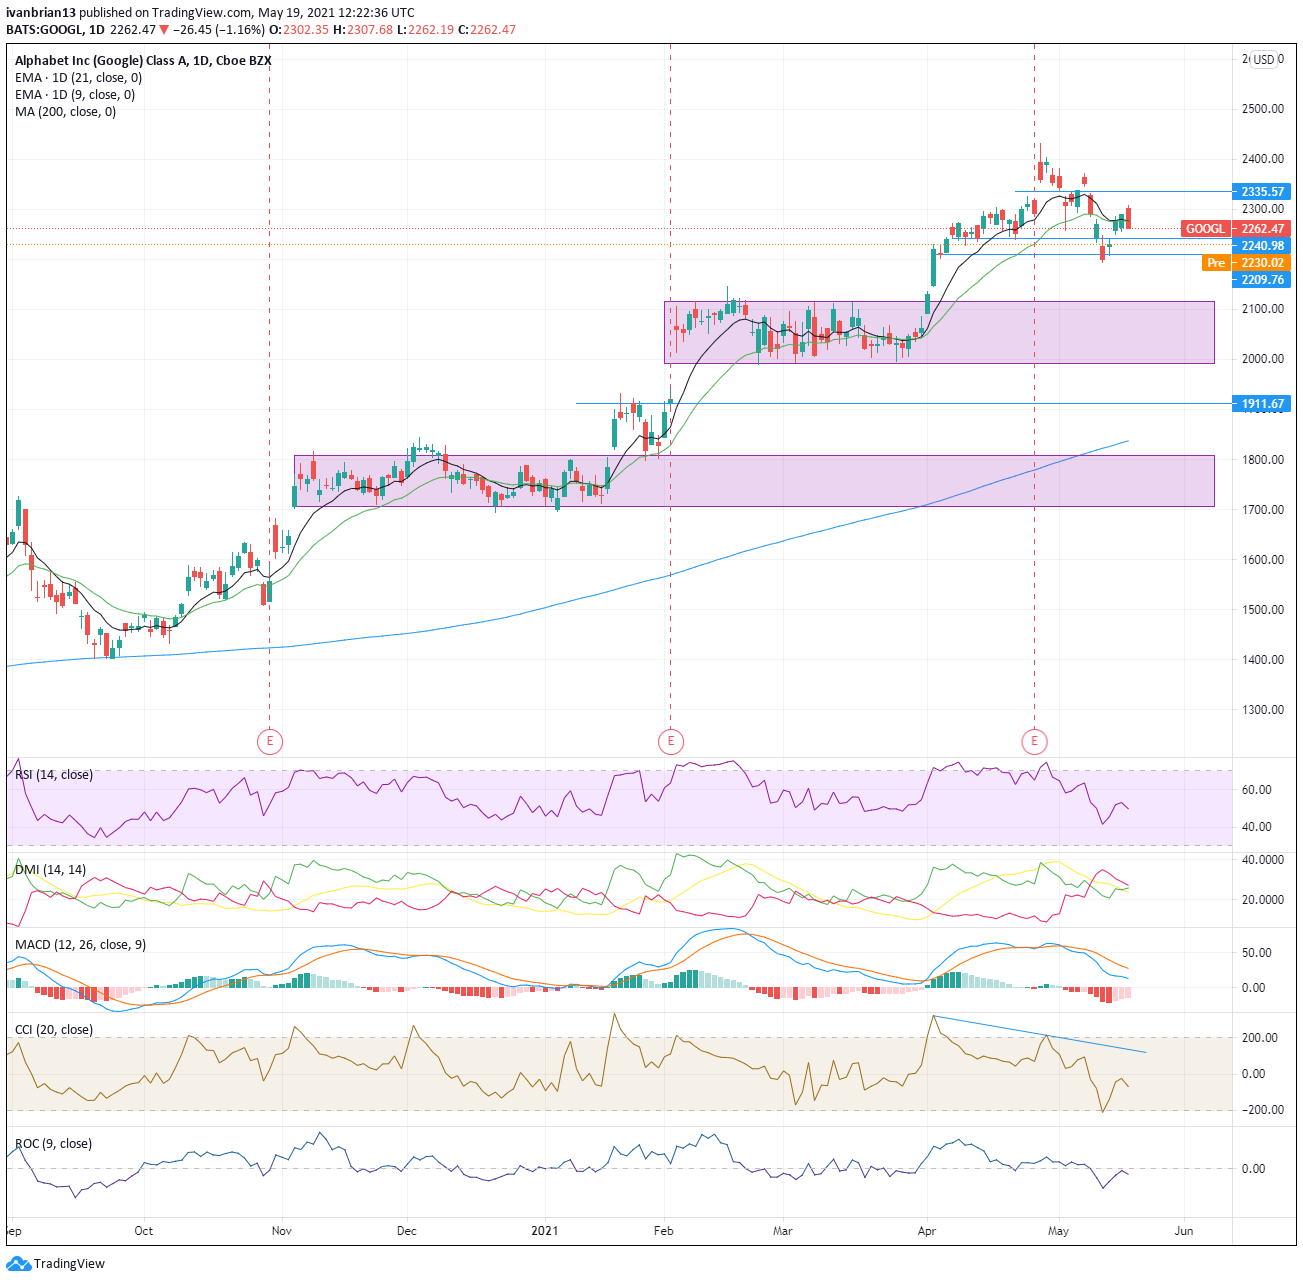
Google (GOOGL) stock forecast
Google looks possibly the most bullish of the names today but still nothing too dramatic to get stuck into. GOOGL has bounced from support at $2,209 and also broken back above the 9 and 21-day moving averages. The short-term trend is moderately bullish. $2,335 should see a test, and a break should really see new highs. The one fear is that staying in this $2,240-2,335 range creates a head-and-shoulders formation with bearish connotations and a target toward $2,000. Again, there is nothing too high conviction showing. Breaks of $2,209 or $2,335 are the bearish and bullish pivots. Strong support regions are highlighted at $2,100-2,000 and $1,800-1.700.
| Support | 2241 | 2209 | 2100 | 2000 | 1911 weak | 1800 | 1700 |
| Resistance | 2335 | 3431 | 2500 |
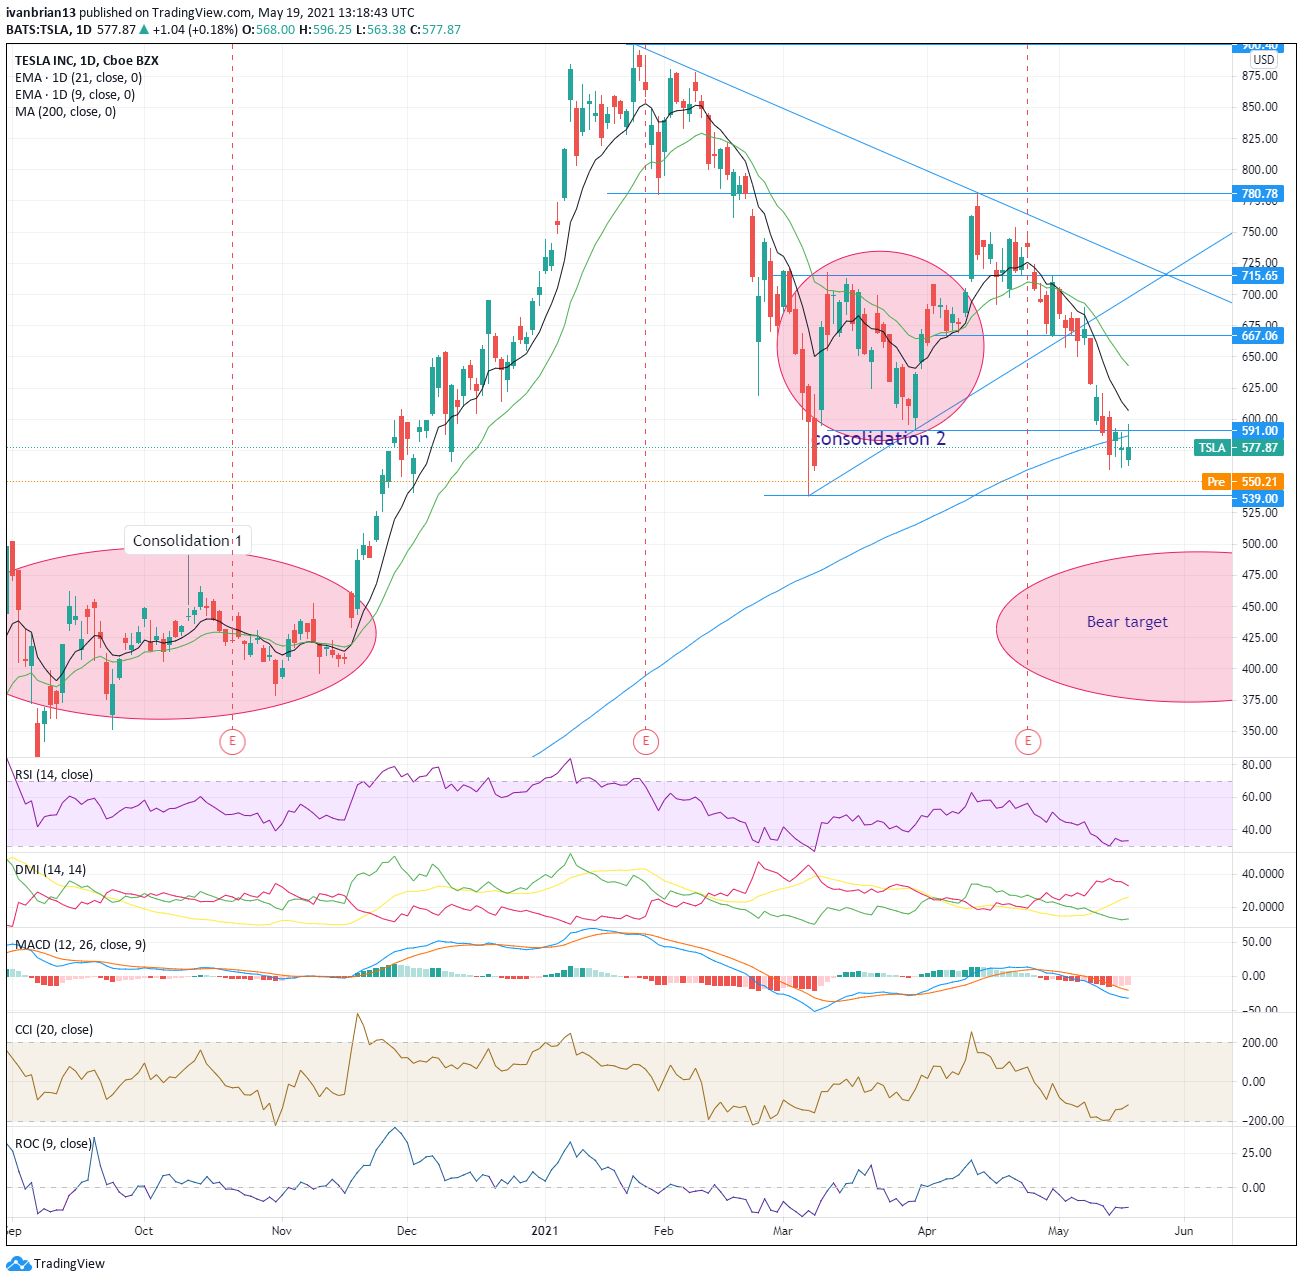
Tesla (TSLA) stock forecast
Finally, we save the best until last (or the worst, depending on your view). The fundamentals look stretched for Tesla, with a huge price/earnings (PE) multiple and increased competition from legacy automakers. The technical view is also less than rosy. TSLA has had a rough 2021, but given the price rise in 2020, this should not come as too much of a surprise. Tesla now looks to have more or less firmly broken 200-day moving average support with a retracement to confirm on Tuesday. The Tuesday move stalled at $591. $539 remains the first target and then sub-$500.
| Support | 539 | 500 | 465 | 430 | ||
| Resistance | 586 200-day | 591 | 667 bullish | 715 | 781 | 900 |
At the time of writing, the author has no position in any stock mentioned in this article and no business relationship with any company mentioned. The author has not received compensation for writing this article, other than from FXStreet.
This article is for information purposes only. The author and FXStreet are not registered investment advisors and nothing in this article is intended to be investment advice. It is important to perform your own research before making any investment and take independent advice from a registered investment advisor.
FXStreet and the author do not provide personalized recommendations. The author makes no representations as to accuracy, completeness, or the suitability of this information. FXStreet and the author will not be liable for any errors, omissions or any losses, injuries or damages arising from this information and its display or use. The author will not be held responsible for information that is found at the end of links posted on this page.
Errors and omissions excepted.
Premium
You have reached your limit of 3 free articles for this month.
Start your subscription and get access to all our original articles.
Author

Ivan Brian
FXStreet
Ivan Brian started his career with AIB Bank in corporate finance and then worked for seven years at Baxter. He started as a macro analyst before becoming Head of Research and then CFO.


