• June’s US Nonfarm Payrolls report exceeded expectations, further cementing the case for a Fed’s 75 bps rate hike.
  • The consensus amongst ECB policymakers is for a 25 bps rate hike in July; September is still open.
  • EUR/USD Price Analysis: Sellers in control might take a breather before launching an assault towards parity.

EUR/USD remains subdued as North American traders prepared for the weekend, in choppy trading within the 1.0150-80 range after June’s employment report and further Fed speakers crossing wires.

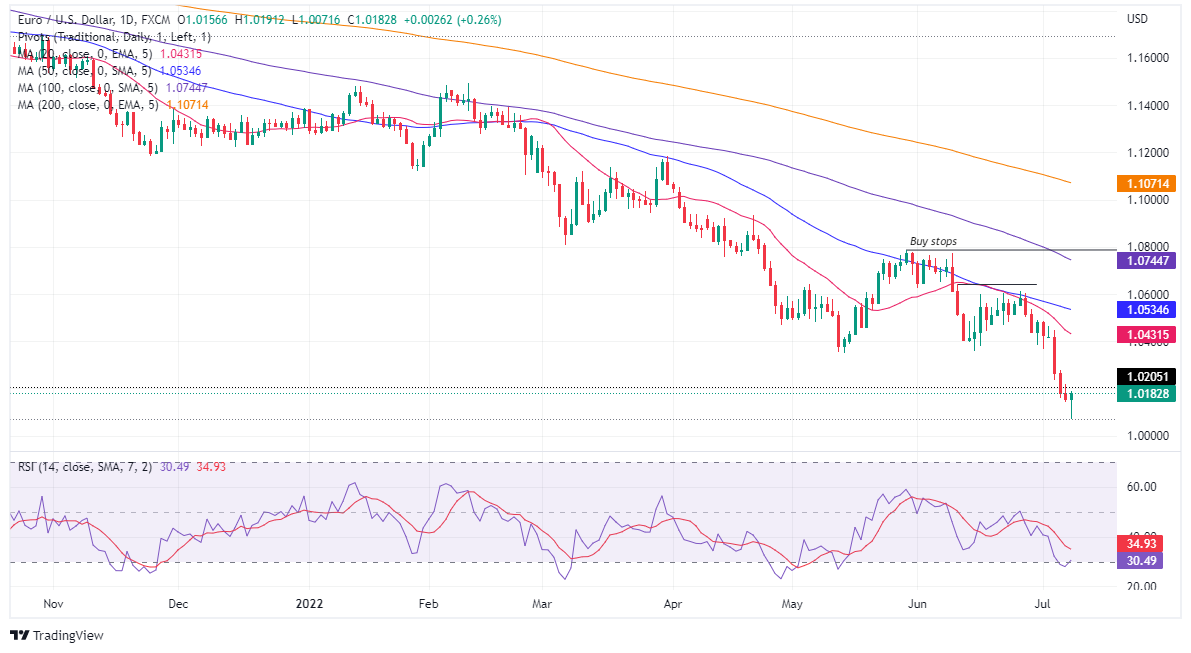
The EUR/USD is trading at 1.0182, having hit a fresh 20-year low at 1.0071 during the European session, though recovered after the release of the US Nonfarm Payrolls report, bouncing off late towards daily highs near 1.0190, before losing steam and settling at around current levels.

EUR/USD rallied despite solid US job report, EU’s energy crisis

Earlier in the North American session, the US Department of Labour reported that June’s Nonfarm Payrolls added 372K jobs to the economy, exceeding estimations of 268K. Average Hourly Earnings, and an indication of a wage-price spiral, remained contained at 5.1% YoY, above estimates, while the Unemployment rate prevailed unchanged at 3.6%. At the same time Fed speakers, namely Waller, Bullard, Bostic, and Williams, reiterated the case for a 75 bps rate hike to the Federal funds rate (FFR), while downplaying recession fears.

On the Eurozone side, ECB speakers remain vocal about hiking rates this month, and the consensus remained around a 25 bps rate hike. However, a 50 bps could be in play, but it is not the case scenario, as mentioned on its June minutes. Despite all that, the EU’s ongoing energy crisis hit the shared currency hard during the week, as the EUR/USD weekly chart illustrates the major is losing 2.47% in the week

Therefore, the EUR/USD path of least resistance is tilted to the downside, and a parity test is on the cards.

EUR/USD Price Analysis: Technical outlook

The EUR/USD daily chart indicates that sellers are in control, despite buyers’ effort to hold the fort around 1.0100. As the New York session waned, they achieved their task so far. However, oscillators like the Relative Strength Index (RS) exited oversold conditions, meaning sellers might be taking a breather before exerting additional pressure to drag prices lower.

Therefore, the EUR/USD first support would be 1.0100. Once cleared, the next support would be the current YTD low at 1.0071, followed by the EUR/USD parity at 1.0000. A decisive break would clear the way for September 2002 lows around 0.9608.

EUR/USD

Overview
Today last price 1.0182
Today Daily Change 0.0022
Today Daily Change % 0.22
Today daily open 1.0162
 
Trends
Daily SMA20 1.0451
Daily SMA50 1.0545
Daily SMA100 1.0758
Daily SMA200 1.108
 
Levels
Previous Daily High 1.0221
Previous Daily Low 1.0144
Previous Weekly High 1.0615
Previous Weekly Low 1.0366
Previous Monthly High 1.0774
Previous Monthly Low 1.0359
Daily Fibonacci 38.2% 1.0174
Daily Fibonacci 61.8% 1.0192
Daily Pivot Point S1 1.013
Daily Pivot Point S2 1.0099
Daily Pivot Point S3 1.0053
Daily Pivot Point R1 1.0207
Daily Pivot Point R2 1.0253
Daily Pivot Point R3 1.0284


Share: Feed news

Information on these pages contains forward-looking statements that involve risks and uncertainties. Markets and instruments profiled on this page are for informational purposes only and should not in any way come across as a recommendation to buy or sell in these assets. You should do your own thorough research before making any investment decisions. FXStreet does not in any way guarantee that this information is free from mistakes, errors, or material misstatements. It also does not guarantee that this information is of a timely nature. Investing in Open Markets involves a great deal of risk, including the loss of all or a portion of your investment, as well as emotional distress. All risks, losses and costs associated with investing, including total loss of principal, are your responsibility. The views and opinions expressed in this article are those of the authors and do not necessarily reflect the official policy or position of FXStreet nor its advertisers. The author will not be held responsible for information that is found at the end of links posted on this page.

If not otherwise explicitly mentioned in the body of the article, at the time of writing, the author has no position in any stock mentioned in this article and no business relationship with any company mentioned. The author has not received compensation for writing this article, other than from FXStreet.

FXStreet and the author do not provide personalized recommendations. The author makes no representations as to the accuracy, completeness, or suitability of this information. FXStreet and the author will not be liable for any errors, omissions or any losses, injuries or damages arising from this information and its display or use. Errors and omissions excepted.

The author and FXStreet are not registered investment advisors and nothing in this article is intended to be investment advice.

Recommended content


Recommended content

Editors’ Picks

AUD/USD tumbles toward 0.6350 as Middle East war fears mount

AUD/USD tumbles toward 0.6350 as Middle East war fears mount

AUD/USD has come under intense selling pressure and slides toward 0.6350, as risk-aversion intensifies following the news that Israel retaliated with missile strikes on a site in Iran. Fears of the Israel-Iran strife translating into a wider regional conflict are weighing on the higher-yielding Aussie Dollar. 

AUD/USD News

USD/JPY breaches 154.00 as sell-off intensifies on Israel-Iran escalation

USD/JPY breaches 154.00 as sell-off intensifies on Israel-Iran escalation

USD/JPY is trading below 154.00 after falling hard on confirmation of reports of an Israeli missile strike on Iran, implying that an open conflict is underway and could only spread into a wider Middle East war. Safe-haven Japanese Yen jumped, helped by BoJ Governor Ueda's comments. 

USD/JPY News

Gold price jumps above $2,400 as MidEast escalation sparks flight to safety

Gold price jumps above $2,400 as MidEast escalation sparks flight to safety

Gold price has caught a fresh bid wave, jumping beyond $2,400 after Israel's retaliatory strikes on Iran sparked a global flight to safety mode and rushed flows into the ultimate safe-haven Gold. Risk assets are taking a big hit, as risk-aversion creeps into Asian trading on Friday. 

Gold News

WTI surges to $85.00 amid Israel-Iran tensions

WTI surges to $85.00 amid Israel-Iran tensions

Western Texas Intermediate, the US crude oil benchmark, is trading around $85.00 on Friday. The black gold gains traction on the day amid the escalating tension between Israel and Iran after a US official confirmed that Israeli missiles had hit a site in Iran.

Oil News

Dogwifhat price pumps 5% ahead of possible Coinbase effect

Dogwifhat price pumps 5% ahead of possible Coinbase effect

Dogwifhat price recorded an uptick on Thursday, going as far as to outperform its peers in the meme coins space. Second only to Bonk Inu, WIF token’s show of strength was not just influenced by Bitcoin price reclaiming above $63,000.

Read more

Forex MAJORS

Cryptocurrencies

Signatures