EUR/USD recovers to top end of consolidation ahead of Friday’s US NFP
- EUR/USD rebounds into high side of near-term range.
- US NFP labor figures to be pivotal data point this week.
- Investors looking for easing labor and slowing wages to bolster rate cut chances.

EUR/USD drove back to the top end of recent consolidation on Thursday, recovering chart territory north of the 1.0700 handle as market risk appetite regains balance heading into another US Nonfarm Payrolls (NFP) Friday.
European economic data is sparse on Friday, leaving investors to focus on US labor figures due early in the American market session. US NFP labor data is expected to show 243K net job additions in the month of April, down slightly from the previous 12-month peak of 303K. With market bets of when and how often the US Federal Reserve (Fed) will finally cut interest rates, investors are hoping for an easing in the pace of hiring to signal a downturn in the US economy which continues to chug along at a breakneck pace compared to most of the developed world.
US Average Hourly Earnings in April are also forecast to hold steady at 0.3% MoM, with wage growth a key fear point for inflationary pressures. At current cut, the rate markets are expecting a first quarter-point trim from the Fed in September, with 62% odds of at least a 25 basis point reduction according to the CME’s FedWatch Tool.
EUR/USD technical outlook
EUR/USD is back into the top side of recent consolidation, testing into the bottom end of a supply zone between 1.0750 and 1.0720. Price action has been cycling the 200-hour Exponential Moving Average (EMA) as markets await a direct driver to influence directional bias.
Daily candlesticks have baked in a pattern of lower highs and lower lows, adding weight to bearish momentum as the pair struggles to develop topside movement from the last swing low into 1.0600. EUR/USD is still trading on the bearish side of the 200-day EMA at 1.0971, and the pair is down 3.7% from the last major swing high into 1.1140 at the tail end of December.
EUR/USD hourly chart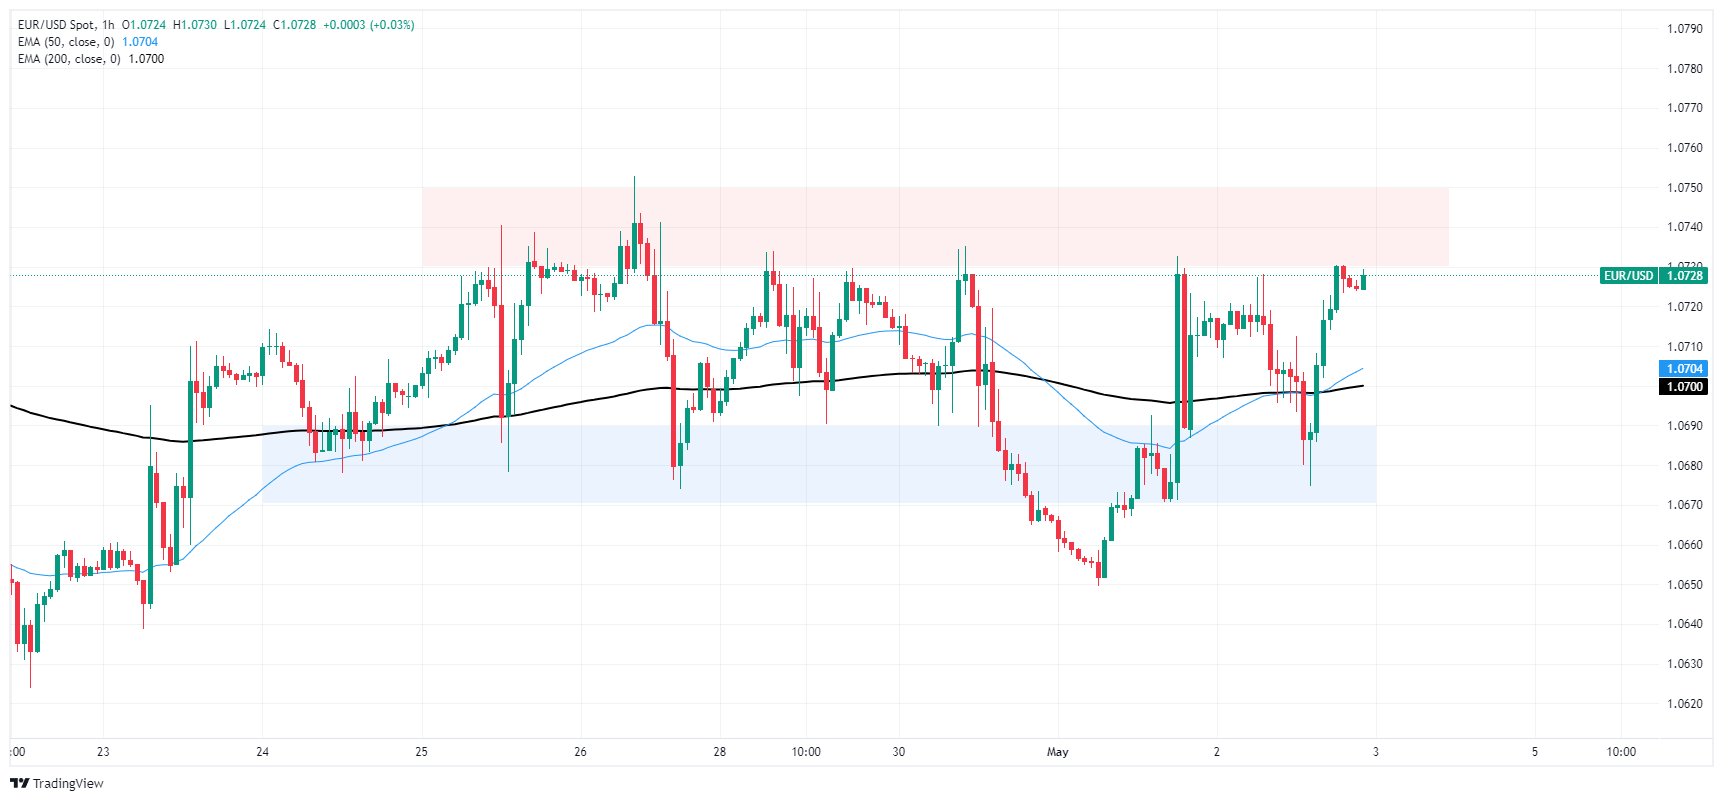
EUR/USD daily chart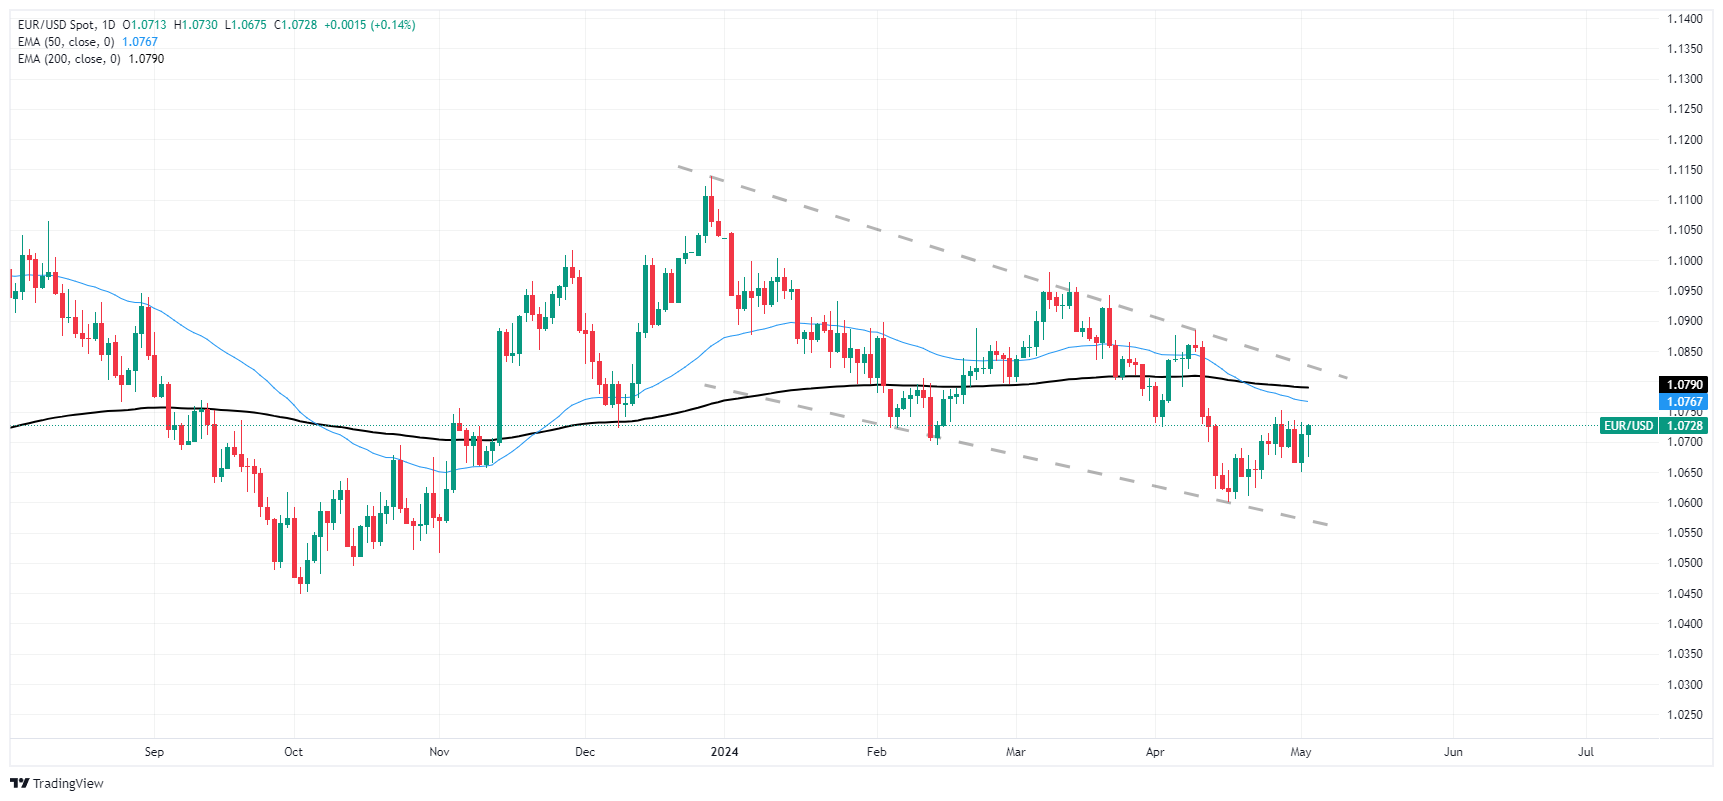
Author

Joshua Gibson
FXStreet
Joshua joins the FXStreet team as an Economics and Finance double major from Vancouver Island University with twelve years' experience as an independent trader focusing on technical analysis.


