EUR/USD Price Analysis: Slides towards 1.0470 immediate support, rising wedge eyed


  • EUR/USD reverses the previous day’s rebound during the first weekly loss in three.
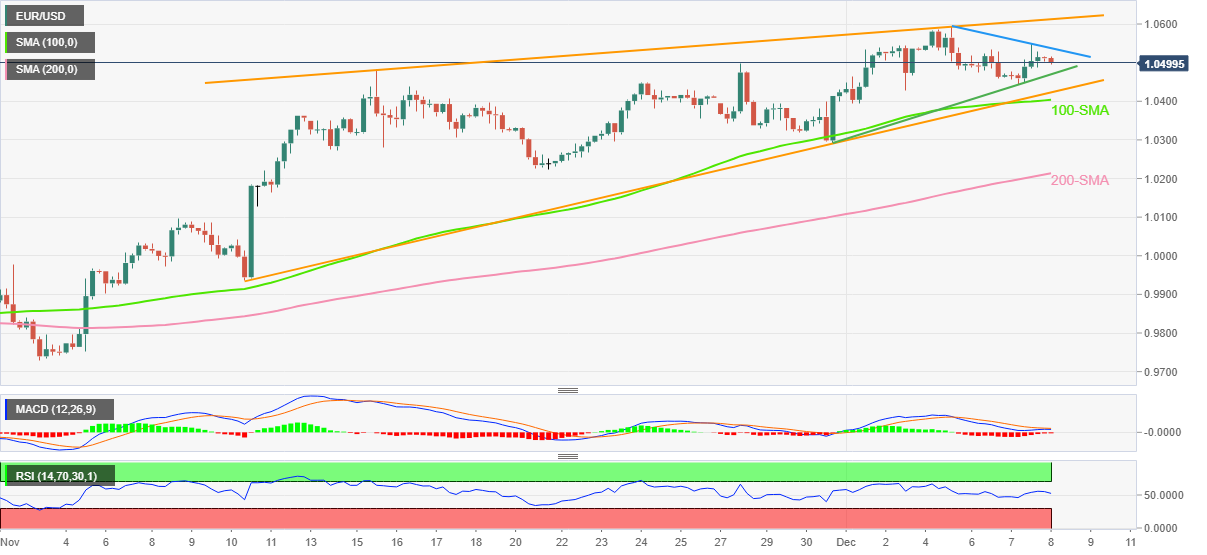
  • Downbeat oscillators direct intraday sellers towards one-week-old ascending trend line.
  • Rising wedge keeps bears hopeful, 100-SMA adds to the downside filter.

EUR/USD takes offers to reverse the previous day’s recovery around 1.0500, snapping a two-week uptrend during early Thursday.

The major currency pair’s latest losses could be linked to the failure to cross the downward-sloping resistance line from Monday. Also favoring the bearish bias are the downbeat MACD signals and mostly steady RSI (14).

Above all, a one-month-old rising wedge bearish formation at the highest levels in six months keeps the AUD/USD sellers hopeful.

That said, the EUR/USD pair’s latest declines aim for the one-week-old support line, near 1.0470.

However, the aforementioned rising wedge’s support line and the 100-SMA, respectively around 1.0425 and 1.0400, could challenge the quote’s additional south run.

It’s worth noting that the 200-SMA near 1.0210 and the November 10 swing low around 0.9935 act as the last defenses of the EUR/USD buyers, a break of which won’t hesitate to direct bears towards the theoretical target of rising wedge confirmation, near 0.9740.

Meanwhile, recovery moves will initially aim for the aforementioned resistance line stretched from Monday, near 1.0540.

Following that, the latest multi-day high near 1.0600 and the stated wedge’s upper line, close to 1.0615 by the press time, may challenge the EUR/USD bulls.

EUR/USD: Four-hour chart

Trend: Further downside expected

Additional important levels

Overview
Today last price 1.05
Today Daily Change -0.0010
Today Daily Change % -0.10%
Today daily open 1.051
 
Trends
Daily SMA20 1.0384
Daily SMA50 1.007
Daily SMA100 1.0059
Daily SMA200 1.0357
 
Levels
Previous Daily High 1.055
Previous Daily Low 1.0443
Previous Weekly High 1.0545
Previous Weekly Low 1.029
Previous Monthly High 1.0497
Previous Monthly Low 0.973
Daily Fibonacci 38.2% 1.0509
Daily Fibonacci 61.8% 1.0484
Daily Pivot Point S1 1.0452
Daily Pivot Point S2 1.0394
Daily Pivot Point S3 1.0345
Daily Pivot Point R1 1.0559
Daily Pivot Point R2 1.0608
Daily Pivot Point R3 1.0665


Share: Feed news

Information on these pages contains forward-looking statements that involve risks and uncertainties. Markets and instruments profiled on this page are for informational purposes only and should not in any way come across as a recommendation to buy or sell in these assets. You should do your own thorough research before making any investment decisions. FXStreet does not in any way guarantee that this information is free from mistakes, errors, or material misstatements. It also does not guarantee that this information is of a timely nature. Investing in Open Markets involves a great deal of risk, including the loss of all or a portion of your investment, as well as emotional distress. All risks, losses and costs associated with investing, including total loss of principal, are your responsibility. The views and opinions expressed in this article are those of the authors and do not necessarily reflect the official policy or position of FXStreet nor its advertisers. The author will not be held responsible for information that is found at the end of links posted on this page.

If not otherwise explicitly mentioned in the body of the article, at the time of writing, the author has no position in any stock mentioned in this article and no business relationship with any company mentioned. The author has not received compensation for writing this article, other than from FXStreet.

FXStreet and the author do not provide personalized recommendations. The author makes no representations as to the accuracy, completeness, or suitability of this information. FXStreet and the author will not be liable for any errors, omissions or any losses, injuries or damages arising from this information and its display or use. Errors and omissions excepted.

The author and FXStreet are not registered investment advisors and nothing in this article is intended to be investment advice.

Recommended content


Recommended content

Editors’ Picks

EUR/USD clings to gains above 1.0750 after US data

EUR/USD clings to gains above 1.0750 after US data

EUR/USD manages to hold in positive territory above 1.0750 despite retreating from the fresh multi-week high it set above 1.0800 earlier in the day. The US Dollar struggles to find demand following the weaker-than-expected NFP data.

EUR/USD News

GBP/USD declines below 1.2550 following NFP-inspired upsurge

GBP/USD declines below 1.2550 following NFP-inspired upsurge

GBP/USD struggles to preserve its bullish momentum and trades below 1.2550 in the American session. Earlier in the day, the disappointing April jobs report from the US triggered a USD selloff and allowed the pair to reach multi-week highs above 1.2600.

GBP/USD News

Gold struggles to hold above $2,300 despite falling US yields

Gold struggles to hold above $2,300 despite falling US yields

Gold stays on the back foot below $2,300 in the American session on Friday. The benchmark 10-year US Treasury bond yield stays in negative territory below 4.6% after weak US data but the improving risk mood doesn't allow XAU/USD to gain traction.

Gold News

Bitcoin Weekly Forecast: Should you buy BTC here? Premium

Bitcoin Weekly Forecast: Should you buy BTC here?

Bitcoin (BTC) price shows signs of a potential reversal but lacks confirmation, which has divided the investor community into two – those who are buying the dips and those who are expecting a further correction.

Read more

Week ahead – BoE and RBA decisions headline a calm week

Week ahead – BoE and RBA decisions headline a calm week

Bank of England meets on Thursday, unlikely to signal rate cuts. Reserve Bank of Australia could maintain a higher-for-longer stance. Elsewhere, Bank of Japan releases summary of opinions.

Read more

Forex MAJORS

Cryptocurrencies

Signatures