EUR/USD Price Analysis: Remains below 50-day SMA, bearish flag pattern in play ahead of NFP
- EUR/USD oscillates in a narrow trading band on Friday as investors keenly await the US NFP report.
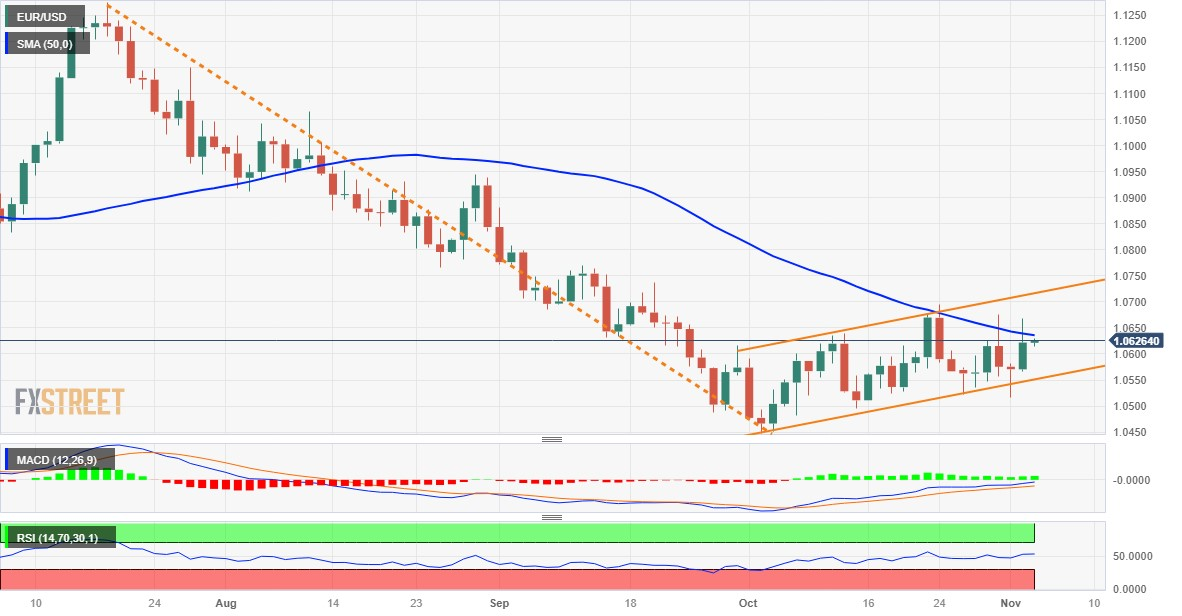
- The formation of a bearish flag pattern warrants caution before positioning for any further upside.
- Weakness below the 1.0600 mark could attract some dip-buying near the ascending channel support.

The EUR/USD pair holds steady through the Asian session on Friday and for now, seems to have stalled the overnight pullback from the vicinity of the 1.0670-1.0675 hurdle, or the weekly high. Spot prices currently trade around the 1.0625-1.0630 region, nearly unchanged for the day, as traders keenly await the US NFP report before positioning for the next leg of a directional move.
From a technical perspective, oscillators on the daily chart have again started gaining positive traction and support prospects for some meaningful appreciating move amid bets that the Federal Reserve (Fed) is nearing the end of its rate-hiking cycle. That said, the recent repeated failures near the 50-day Simple Moving Average (SMA) warrants caution before placing bullish bets around the EUR/USD pair. Moreover, the recovery from the YTD low, around the 1.0445-1.0450 area touched in October, along an upward-sloping channel constitutes the formation of a bearish flag pattern, against the backdrop of a sharp fall from a 17-month peak touched in June.
Hence, the 1.0665-1.0670 area might continue to act as an immediate strong barrier, above which the EUR/USD pair could aim to reclaim the 1.0700 mark and test the top boundary of the aforementioned trend channel, currently around the 1.0715 region. A sustained strength beyond the latter will negate the bearish setup and pave the way for additional gains. Spot prices might then accelerate the positive move towards the next relevant hurdle near the 1.0765 area en route to the 1.0800 round figure.
On the flip side, weakness back below the 1.0600 mark now seems to attract some buyers around the 1.0570 zone, nearing the ascending channel support. This is followed by over a two-week low, around the 1.0520-1.0515 region touched on Wednesday, and the 1.0500 psychological mark, which if broken decisively will be seen as a fresh trigger for bearish traders. The EUR/USD pair might then weaken further below the 1.0450-1.0445 area, or the YTD low, towards testing the 1.0400 round figure.
EUR/USD daily chart
Tehnical levels to watch
Author

Haresh Menghani
FXStreet
Haresh Menghani is a detail-oriented professional with 10+ years of extensive experience in analysing the global financial markets.