EUR/USD Price Analysis: Refreshes two-month high, bulls keep reins above 1.2100


  • EUR/USD stays bid near the multi-day high, prints three-day winning streak.
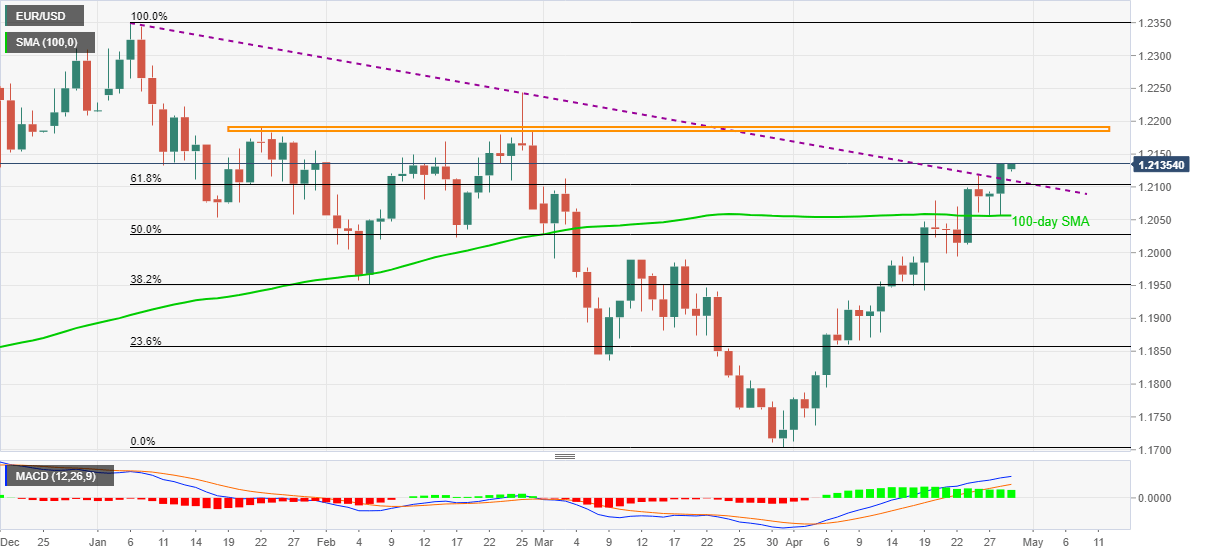
  • Clear break of yearly resistance line, 61.8% Fibonacci retracement back the bulls.
  • Three-month-old horizontal area lure buyers, 100-day SMA adds to the downside filters.

EUR/USD rises to a fresh high since late February while taking the bids near 1.2135, up 0.07% intraday, during Thursday’s Asian session. In doing so, the currency major pair print gains for the third consecutive day after bouncing off 100-day SMA earlier in the week.

Not only the sustained trading beyond 100-day SMA but the quote’s successful upside break of a descending resistance line from January 06, now support, as well as 61.8% Fibonacci retracement of January-March declines, also back the EUR/USD bulls.

As a result, the pair’s run-up towards 1.2185-90 horizontal area comprising multiple highs marked since February 26 can’t be ruled out. However, 1.2210 and February’s top near 1.2245 will test any further upside past-1.2190.

Meanwhile, the recently broken trend line and 61.8% Fibonacci retracement, respectively around 1.2110 and 1.2100, restrict the EUR/USD pair’s short-term downside ahead of the 100-day SMA level of 1.2056.

If at all the EUR/USD bears take charge below 1.2056, 50% Fibonacci retracement level and highs marked during March 11-18, near 1.2030 and 1.1990 in that order, will challenge the quote’s further weakness.

EUR/USD daily chart

Trend: Bullish

Additional important levels

Overview
Today last price 1.2135
Today Daily Change 45 pips
Today Daily Change % 0.37%
Today daily open 1.209
 
Trends
Daily SMA20 1.1941
Daily SMA50 1.1955
Daily SMA100 1.2056
Daily SMA200 1.1936
 
Levels
Previous Daily High 1.2093
Previous Daily Low 1.2057
Previous Weekly High 1.21
Previous Weekly Low 1.1943
Previous Monthly High 1.2113
Previous Monthly Low 1.1704
Daily Fibonacci 38.2% 1.2079
Daily Fibonacci 61.8% 1.2071
Daily Pivot Point S1 1.2067
Daily Pivot Point S2 1.2044
Daily Pivot Point S3 1.203
Daily Pivot Point R1 1.2103
Daily Pivot Point R2 1.2116
Daily Pivot Point R3 1.2139


Share: Feed news

Information on these pages contains forward-looking statements that involve risks and uncertainties. Markets and instruments profiled on this page are for informational purposes only and should not in any way come across as a recommendation to buy or sell in these assets. You should do your own thorough research before making any investment decisions. FXStreet does not in any way guarantee that this information is free from mistakes, errors, or material misstatements. It also does not guarantee that this information is of a timely nature. Investing in Open Markets involves a great deal of risk, including the loss of all or a portion of your investment, as well as emotional distress. All risks, losses and costs associated with investing, including total loss of principal, are your responsibility. The views and opinions expressed in this article are those of the authors and do not necessarily reflect the official policy or position of FXStreet nor its advertisers. The author will not be held responsible for information that is found at the end of links posted on this page.

If not otherwise explicitly mentioned in the body of the article, at the time of writing, the author has no position in any stock mentioned in this article and no business relationship with any company mentioned. The author has not received compensation for writing this article, other than from FXStreet.

FXStreet and the author do not provide personalized recommendations. The author makes no representations as to the accuracy, completeness, or suitability of this information. FXStreet and the author will not be liable for any errors, omissions or any losses, injuries or damages arising from this information and its display or use. Errors and omissions excepted.

The author and FXStreet are not registered investment advisors and nothing in this article is intended to be investment advice.

Recommended content


Recommended content

Editors’ Picks

AUD/USD eases toward 0.6500 after mixed Australian trade data

AUD/USD eases toward 0.6500 after mixed Australian trade data

AUD/USD is seeing some fresh selling interest in the Asian session on Thursday, following the release of mixed Australian trade data. The pair has stalled its recovery mode, as the US Dollar attempts a bounce after the Fed-led sell-off.   

AUD/USD News

USD/JPY rebounds above 156.00 after probable Japan's intervention-led crash

USD/JPY rebounds above 156.00 after probable Japan's intervention-led crash

USD/JPY is staging a solid comeback above 156.00, having lost nearly 450 pips in some minutes after the Japanese Yen rallied hard on another suspected Japan FX market intervention in the late American session on Wednesday. 

USD/JPY News

Gold price stalls rebound below $2,330 as US Dollar recovers

Gold price stalls rebound below $2,330 as US Dollar recovers

Gold price is holding the rebound below $2,330 in Asian trading on Thursday, as the US Dollar recovers in sync with the USD/JPY pair and the US Treasury bond yields, in the aftermath of the Fed decision and the likely Japanese FX intervention. 

Gold News

Top 3 Price Prediction BTC, ETH, XRP: Altcoins to pump once BTC bottoms out, slow grind up for now

Top 3 Price Prediction BTC, ETH, XRP: Altcoins to pump once BTC bottoms out, slow grind up for now

Bitcoin reclaiming above $59,200 would hint that BTC has already bottomed out, setting the tone for a run north. Ethereum holding above $2,900 keeps a bullish reversal pattern viable despite falling momentum. Ripple coils up for a move north as XRP bulls defend $0.5000.

Read more

The FOMC whipsaw and more Yen intervention in focus

The FOMC whipsaw and more Yen intervention in focus

Market participants clung to every word uttered by Chair Powell as risk assets whipped around in a frenetic fashion during the afternoon US trading session.

Read more

Forex MAJORS

Cryptocurrencies

Signatures