|

EUR/USD Price Analysis: Euro hits lowest since November 2020

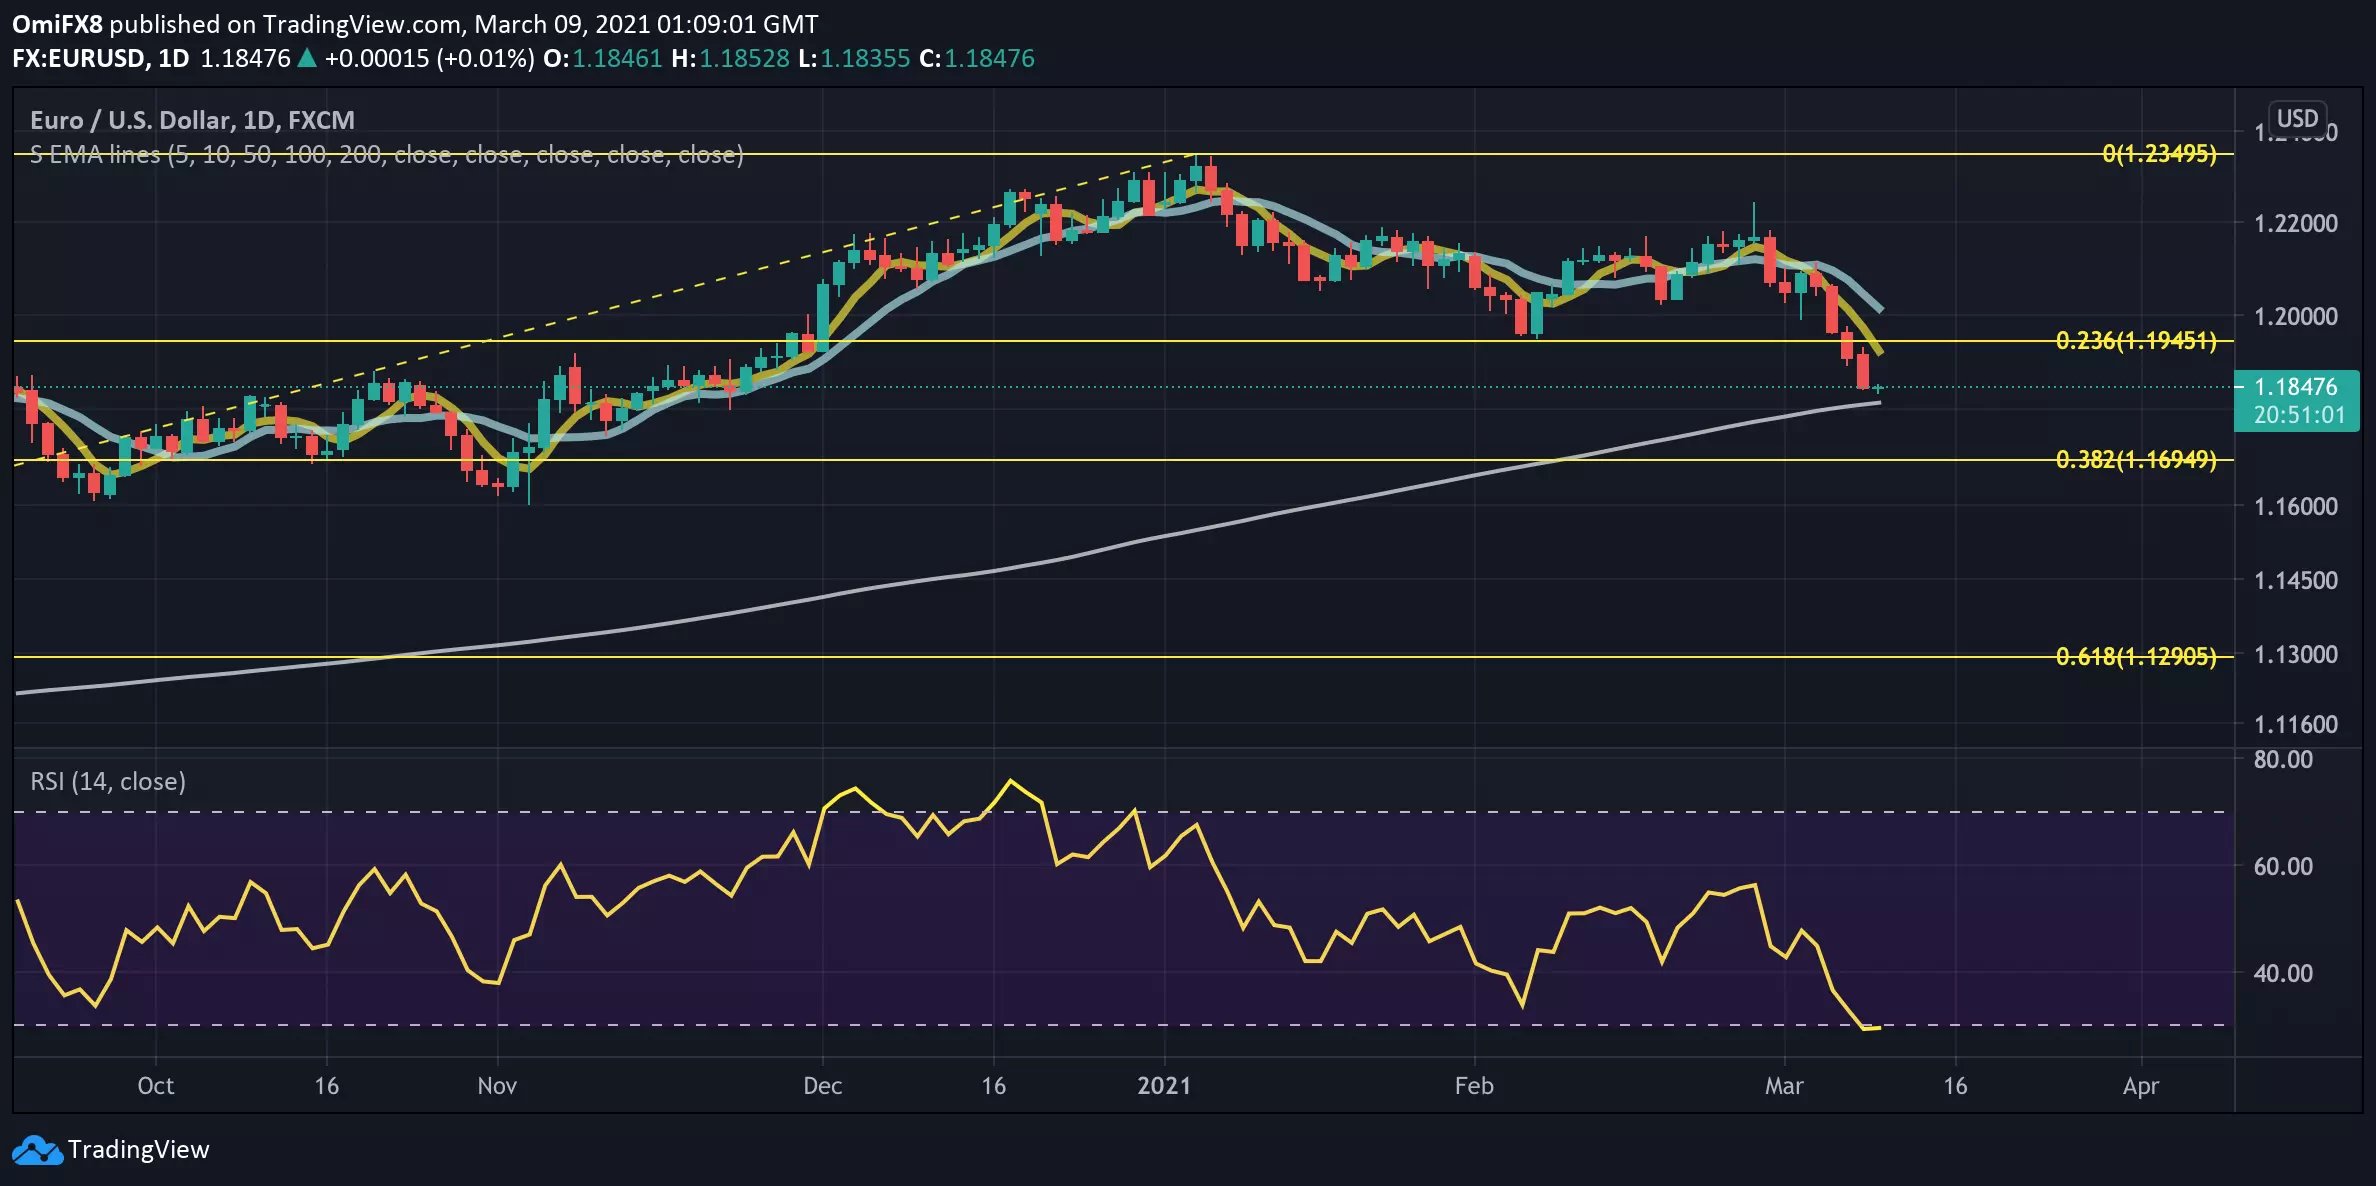
EUR/USD clocked a low of 1.1835 a few minutes before press time. That was the lowest level in four months. 

The 14-day Relative Strength Index (RSI) has dropped below 30, indicating oversold conditions for the first since February 2020. 

However, the indicator needs validation from the price chart, which is currently showing no signs of bear fatigue. Two of the four red candles created over the past four trading days have little or no wicks. It indicates the sellers are in control. 

Also, the downward momentum looks strong with the 5- and 10-day Simple Moving Averages (SMA) trending south. 

The pair appears set to test the 200-day SMA, currently at 1.1816. A violation there would expose 1.1695, which is the 38.2% Fibonacci retracement of the rally from 1.0636 to 1.2349. 

The hourly chart shows a bullish divergence of the RSI. As such, a minor bounce may be seen before a drop to the 200-day SMA. 

Daily chart

Trend: Bearish

Technical levels

EUR/USD

Overview
Today last price1.1844
Today Daily Change-0.0001
Today Daily Change %-0.01
Today daily open1.1845
 
Trends
Daily SMA201.208
Daily SMA501.2124
Daily SMA1001.204
Daily SMA2001.1825
 
Levels
Previous Daily High1.1932
Previous Daily Low1.1845
Previous Weekly High1.2113
Previous Weekly Low1.1893
Previous Monthly High1.2243
Previous Monthly Low1.1952
Daily Fibonacci 38.2%1.1878
Daily Fibonacci 61.8%1.1899
Daily Pivot Point S11.1816
Daily Pivot Point S21.1787
Daily Pivot Point S31.1729
Daily Pivot Point R11.1903
Daily Pivot Point R21.1961
Daily Pivot Point R31.199

Author

Omkar Godbole

Omkar Godbole

FXStreet Contributor

Omkar Godbole, editor and analyst, joined FXStreet after four years as a research analyst at several Indian brokerage companies.

More from Omkar Godbole
Share:

Editor's Picks

EUR/USD clings to humble gains around 1.1780

EUR/USD manages to reverse Tuesday’s pullback, sticking to daily gains around 1.1780 following an earlier bull run past 1.1800 the figure. The pair’s slight advance comes on the back of the equally marginal uptick in the US Dollar, as investors continue to closely follow developments on the trade front and news from the White House.

GBP/USD flirts with weekly tops north of 1.3500

GBP/USD leaves behind the previous day’s decline and regains fresh upside traction on Wednesday, surpassing the 1.3500 barrier in a context of a marginal advance in the Greenback and a generalised improved mood in the risk-associated universe. Meanwhile, the US tariff narrative continues to dictate the mood among market participants.

Gold picks up pace, focus on $5,200

Gold buyers are stepping back in on Wednesday, with sights set on $5,200 and potentially higher, after Tuesday’s pullback from monthly highs. The yellow metal’s recovery follows some loss of momentum in the US Dollar after Trump’s SOTU speech failed to deliver fresh impetus and AI-related jitters continue to fade.

Crypto Today: Bitcoin, Ethereum, XRP test rebound strength as ETF inflows return

Bitcoin, Ethereum and Ripple are gaining traction at the time of writing on Wednesday, amid persistent market doldrums. The Crypto King is up over 2% intraday, trading above $65,000 from the day’s opening of $64,058.

Nvidia remains at the heart of the AI boom

Nvidia remains at the heart of the AI boom, with Q4 revenue projected near $65.6–66.1 billion, nearly 70% higher year-over-year. But investors are watching cash flow, leverage, and broader AI adoption. Growth is strong, but the AI stress isn’t over.

Cosmos Hub Price Forecast: ATOM rebounds slightly, bearish outlook remains intact

Cosmos Hub (ATOM) price rebounds, trading above $2.05 at the time of writing on Wednesday, after undergoing a sharp correction since last week. Weakening on-chain and derivatives data support a bearish outlook, while technical analysis remains unfavorable.