- A triple bottom in the EUR/USD daily chart remains in play but at a brisk of being negated.
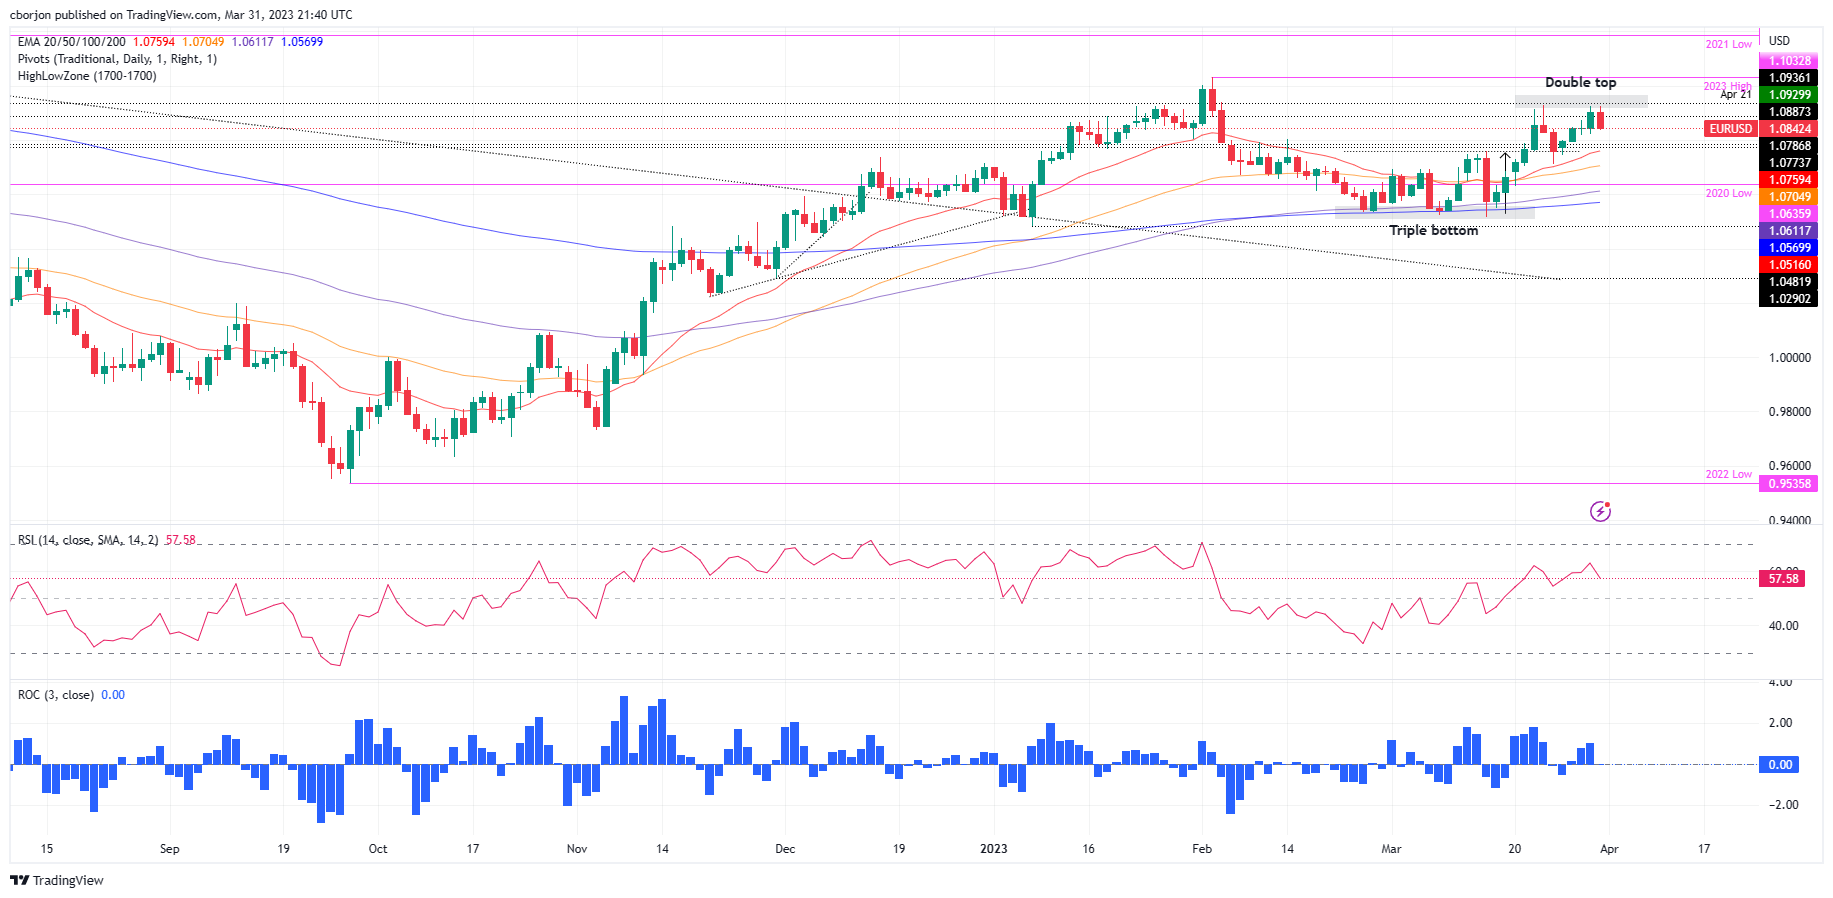
- EUR/USD’s price action during the last couple of weeks created a double top, which could shift the pair’s bias.
The Euro (EUR) drops from around weekly highs of 1.0925 on a buoyant US Dollar (USD) and on buyers’ failure to crack the YTD high at 1.0929. Nevertheless, a triple bottom in the daily chart is intact, at the brisk of being negated. At the time of writing, the EUR/USD is trading at 1.0842.
EUR/USD Price action
Failure to hold prices above the 1.0900 figure has exposed the EUR/USD to further selling pressure. A triple bottom in the daily chart remains in play. But, the upward movement was capped at around March’s 23 high of 1.0929, ahead of testing 1.1000.
For a bullish resumption, EUR/USD buyers must reclaim 1.0900, followed by 1.0929. Break above will expose the 1.1000 figure, followed by the YTD high at 1.1032.
Another scenario has developed in the last couple of weeks. Albeit a “triple bottom” is in place, the formation of a double top emerged. Hence, if the EUR/USD continues to dive further and achieves a daily close below the March 24 swing low of 1.0713, it would pave the way to test 1.0500.
Backing up the latter scenario are oscillators. The Relative Strength Index (RSI), although at bullish territory, its slope turned downwards, while the Rate of Change (RoC) shifted neutral.
EUR/USD Daily chart
EUR/USD Technical levels
Information on these pages contains forward-looking statements that involve risks and uncertainties. Markets and instruments profiled on this page are for informational purposes only and should not in any way come across as a recommendation to buy or sell in these assets. You should do your own thorough research before making any investment decisions. FXStreet does not in any way guarantee that this information is free from mistakes, errors, or material misstatements. It also does not guarantee that this information is of a timely nature. Investing in Open Markets involves a great deal of risk, including the loss of all or a portion of your investment, as well as emotional distress. All risks, losses and costs associated with investing, including total loss of principal, are your responsibility. The views and opinions expressed in this article are those of the authors and do not necessarily reflect the official policy or position of FXStreet nor its advertisers. The author will not be held responsible for information that is found at the end of links posted on this page.
If not otherwise explicitly mentioned in the body of the article, at the time of writing, the author has no position in any stock mentioned in this article and no business relationship with any company mentioned. The author has not received compensation for writing this article, other than from FXStreet.
FXStreet and the author do not provide personalized recommendations. The author makes no representations as to the accuracy, completeness, or suitability of this information. FXStreet and the author will not be liable for any errors, omissions or any losses, injuries or damages arising from this information and its display or use. Errors and omissions excepted.
The author and FXStreet are not registered investment advisors and nothing in this article is intended to be investment advice.
Recommended content
Editors’ Picks
EUR/USD loses traction, retreats below 1.0600

EUR/USD lost its recovery momentum and declined below 1.0600 in the American session on Friday, erasing a portion of its daily gains in the process. Nevertheless, the risk-positive market atmosphere after PCE inflation data helps the pair limit its losses.
GBP/USD turns negative on the day below 1.2200

GBP/USD reversed its direction and slumped below 1.2200 in the American session on Friday after rising above 1.2270 earlier in the day. Position readjustments and profit-taking on the last trading day of the quarter seems to be weighing on Pound Sterling.
Gold reverses direction, drops below $1,860

Following a steady rebound toward $1,880 on Friday, Gold price made a sharp U-turn and turned negative on the day near $1,860. Although the 10-year US T-bond yield is down more than 1%, XAU/USD struggles to find demand on the last day of Q3.
Polkadot Price Forecast: DOT reversal seems inevitable after 92% correction from all-time high

Polkadot price, in nearly two years, has shed 92.91% from its all-time high of $55.09. The massive downswing in DOT has pushed it down to levels that were last seen in October 2020. Hence, the chances of this altcoin forming a bottom and rallying are high.
Earnings beat triggers Nike to spike 9%

Nike (NKE) stock has surged over 9% in Friday’s premarket, climbing above $98 per share, following late Thursday’s fiscal first-quarter earnings release. Nike beat pessimistic earnings expectations by more than 23% and hiked its dividend by 9%.