EUR/USD Price Analysis: Bulls seek validation from 1.0930 as key inflation data looms


  • EUR/USD seesaws around weekly high after rising the most in one-week the previous day.
  • Upbeat sentiment, softer yields supersede hawkish Fed talks to propel the Euro pair.
  • 10-week-old horizontal resistance area can challenge bulls are RSI turns overbought.
  • Sellers need 50-SMA breakdown to retake control; January’s top can lure bulls past 1.0930 hurdle.

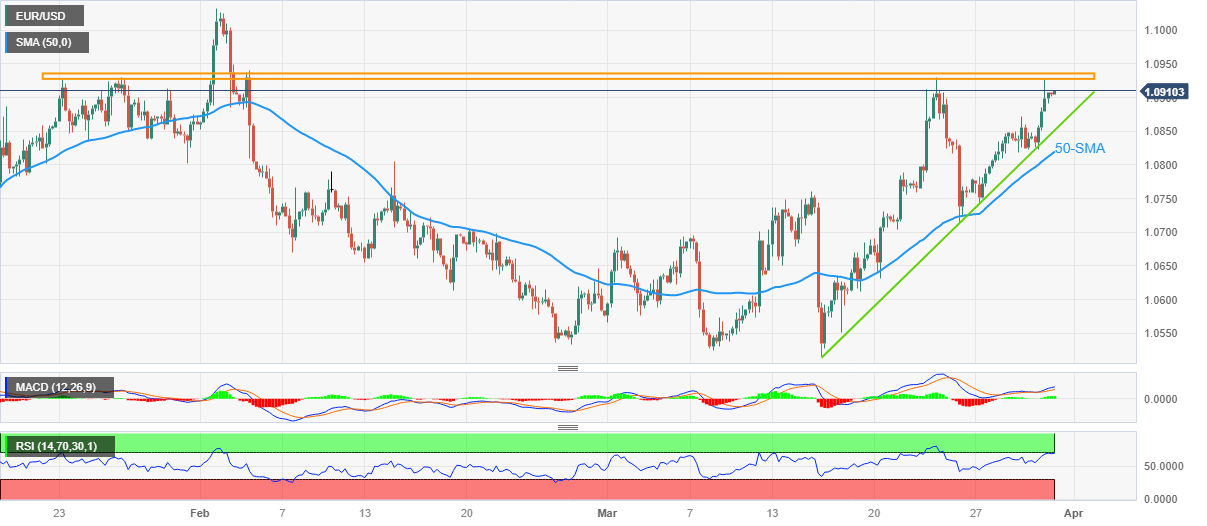
EUR/USD depicts the market’s pre-inflation anxiety while making rounds to 1.0900, after refreshing a one-week high, during early Friday. In doing so, the Euro pair portrays another battle with the key horizontal resistance established on January 23.

Given the overbought RSI (14) and the Euro pair’s repeated failures to cross the 1.0930-35 horizontal resistance area, the pair buyers are likely to witness one more disappointment should the Eurozone inflation data ease and/or US Core PCE Price Index softens.

Also read: EUR/USD Forecast: Positive signs for the Euro ahead of more inflation data

In a case where the EUR/USD bulls ignore the RSI (14) conditions, backed by fundamental support, and cross the 1.0935 hurdle, the odds of witnessing a rally towards the yearly top marked in January near 1.1035 can’t be ruled out.

Meanwhile, a two-week-old ascending support line, close to 1.0850 at the latest, restricts the short-term EUR/USD downside.

Following that, the 50-SMA level surrounding 1.0820 and the mid-March high near 1.0750 can act as the last defenses of the EUR/USD buyers, a break of which could quickly drag the quote towards the monthly low of near 1.0515.

Overall, the EUR/USD pair remains on the bull’s radar unless breaking the 1.0750 level but the limited upside room highlights today’s inflation numbers as the key catalysts.

EUR/USD: Daily chart

Trend: Limited upside expected

Additional important levels

Overview
Today last price 1.0906
Today Daily Change 0.0001
Today Daily Change % 0.01%
Today daily open 1.0905
 
Trends
Daily SMA20 1.0714
Daily SMA50 1.0732
Daily SMA100 1.0646
Daily SMA200 1.034
 
Levels
Previous Daily High 1.0926
Previous Daily Low 1.0824
Previous Weekly High 1.093
Previous Weekly Low 1.0631
Previous Monthly High 1.1033
Previous Monthly Low 1.0533
Daily Fibonacci 38.2% 1.0887
Daily Fibonacci 61.8% 1.0863
Daily Pivot Point S1 1.0844
Daily Pivot Point S2 1.0782
Daily Pivot Point S3 1.0741
Daily Pivot Point R1 1.0947
Daily Pivot Point R2 1.0988
Daily Pivot Point R3 1.105


Share: Feed news

Information on these pages contains forward-looking statements that involve risks and uncertainties. Markets and instruments profiled on this page are for informational purposes only and should not in any way come across as a recommendation to buy or sell in these assets. You should do your own thorough research before making any investment decisions. FXStreet does not in any way guarantee that this information is free from mistakes, errors, or material misstatements. It also does not guarantee that this information is of a timely nature. Investing in Open Markets involves a great deal of risk, including the loss of all or a portion of your investment, as well as emotional distress. All risks, losses and costs associated with investing, including total loss of principal, are your responsibility. The views and opinions expressed in this article are those of the authors and do not necessarily reflect the official policy or position of FXStreet nor its advertisers. The author will not be held responsible for information that is found at the end of links posted on this page.

If not otherwise explicitly mentioned in the body of the article, at the time of writing, the author has no position in any stock mentioned in this article and no business relationship with any company mentioned. The author has not received compensation for writing this article, other than from FXStreet.

FXStreet and the author do not provide personalized recommendations. The author makes no representations as to the accuracy, completeness, or suitability of this information. FXStreet and the author will not be liable for any errors, omissions or any losses, injuries or damages arising from this information and its display or use. Errors and omissions excepted.

The author and FXStreet are not registered investment advisors and nothing in this article is intended to be investment advice.

Recommended content


Recommended content

Editors’ Picks

USD/JPY jumps above 156.00 on BoJ's steady policy

USD/JPY jumps above 156.00 on BoJ's steady policy

USD/JPY has come under intense buying pressure, surging past 156.00 after the Bank of Japan kept the key rate unchanged but tweaked its policy statement. The BoJ maintained its fiscal year 2024 and 2025 core inflation forecasts, disappointing the Japanese Yen buyers. 

USD/JPY News

AUD/USD consolidates gains above 0.6500 after Australian PPI data

AUD/USD consolidates gains above 0.6500 after Australian PPI data

AUD/USD is consolidating gains above 0.6500 in Asian trading on Friday. The pair capitalizes on an annual increase in Australian PPI data. Meanwhile, a softer US Dollar and improving market mood also underpin the Aussie ahead of the US PCE inflation data. 

AUD/USD News

Gold price flatlines as traders look to US PCE Price Index for some meaningful impetus

Gold price flatlines as traders look to US PCE Price Index for some meaningful impetus

Gold price lacks any firm intraday direction and is influenced by a combination of diverging forces. The weaker US GDP print and a rise in US inflation benefit the metal amid subdued USD demand. Hawkish Fed expectations cap the upside as traders await the release of the US PCE Price Index.

Gold News

Stripe looks to bring back crypto payments as stablecoin market cap hits all-time high

Stripe looks to bring back crypto payments as stablecoin market cap hits all-time high

Stripe announced on Thursday that it would add support for USDC stablecoin, as the stablecoin market exploded in March, according to reports by Cryptocompare.

Read more

US economy: Slower growth with stronger inflation

US economy: Slower growth with stronger inflation

The US Dollar strengthened, and stocks fell after statistical data from the US. The focus was on the preliminary estimate of GDP for the first quarter. Annualised quarterly growth came in at just 1.6%, down from the 2.5% and 3.4% previously forecast.

Read more

Forex MAJORS

Cryptocurrencies

Signatures