EUR/USD Price Analysis: Bulls brace for another battle with five-week-old hurdle


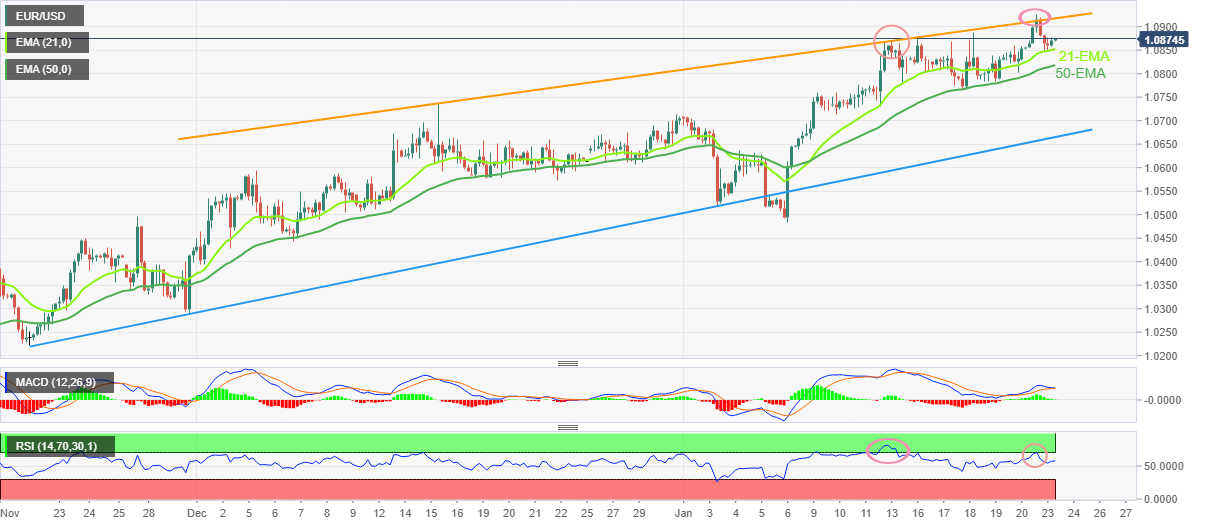
  • EUR/USD picks up bids to reverse pullback from nine-month high, bounces off 21-EMA.
  • Impending bear cross on MACD, RSI divergence tease sellers.
  • Ascending trend line from mid-December appears a tough nut to crack for bulls.

EUR/USD resumes run-up towards the short-term key hurdle as it rises to 1.0875 during early Tuesday, following a retreat from the nine-month high amid late trading hours of the previous day.  In doing so, the major currency pair bounces off the 21-Exponential Moving Average (EMA), around 1.0850 by the press time.

However, an upward-sloping resistance line from December 15, 2022, close to 1.0920 at the latest, challenges the EUR/USD pair’s immediate upside.

In addition to the immediate resistance line, the looming bear cross on the MACD and the bearish RSI divergence, a condition where the higher high in price doesn’t accompany the higher high in the indicator, also challenge the EUR/USD buyers.

It should be noted that the April 2022 peak surrounding 1.0940 acts as an additional upside hurdle, other than the 1.0920, to challenge the pair buyers before directing them towards the 1.1000 round figure.

Alternatively, the 21-EMA and the 50-EMA restrict immediate EUR/USD downside near 1.0850 and 1.0820 respectively.

Following that, the late December 2022 high near 1.0715 and the 1.0700 could please the pair sellers.

In a case where the EUR/USD pair remains bearish past 1.0700, an ascending support line from November 21, close to 1.0665 at the latest, will act as the last defense of the buyers.

EUR/USD: Four-hour chart

Trend: Limited upside expected

Additional important levels

Overview
Today last price 1.0872
Today Daily Change 0.0004
Today Daily Change % 0.04%
Today daily open 1.0868
 
Trends
Daily SMA20 1.0724
Daily SMA50 1.0582
Daily SMA100 1.0241
Daily SMA200 1.031
 
Levels
Previous Daily High 1.0927
Previous Daily Low 1.0846
Previous Weekly High 1.0888
Previous Weekly Low 1.0766
Previous Monthly High 1.0736
Previous Monthly Low 1.0393
Daily Fibonacci 38.2% 1.0896
Daily Fibonacci 61.8% 1.0877
Daily Pivot Point S1 1.0834
Daily Pivot Point S2 1.08
Daily Pivot Point S3 1.0754
Daily Pivot Point R1 1.0915
Daily Pivot Point R2 1.0961
Daily Pivot Point R3 1.0995


Share: Feed news

Information on these pages contains forward-looking statements that involve risks and uncertainties. Markets and instruments profiled on this page are for informational purposes only and should not in any way come across as a recommendation to buy or sell in these assets. You should do your own thorough research before making any investment decisions. FXStreet does not in any way guarantee that this information is free from mistakes, errors, or material misstatements. It also does not guarantee that this information is of a timely nature. Investing in Open Markets involves a great deal of risk, including the loss of all or a portion of your investment, as well as emotional distress. All risks, losses and costs associated with investing, including total loss of principal, are your responsibility. The views and opinions expressed in this article are those of the authors and do not necessarily reflect the official policy or position of FXStreet nor its advertisers. The author will not be held responsible for information that is found at the end of links posted on this page.

If not otherwise explicitly mentioned in the body of the article, at the time of writing, the author has no position in any stock mentioned in this article and no business relationship with any company mentioned. The author has not received compensation for writing this article, other than from FXStreet.

FXStreet and the author do not provide personalized recommendations. The author makes no representations as to the accuracy, completeness, or suitability of this information. FXStreet and the author will not be liable for any errors, omissions or any losses, injuries or damages arising from this information and its display or use. Errors and omissions excepted.

The author and FXStreet are not registered investment advisors and nothing in this article is intended to be investment advice.

Recommended content


Recommended content

Editors’ Picks

EUR/USD nears 1.0800 on broad US Dollar weakness

EUR/USD nears 1.0800 on broad US Dollar weakness

Optimism continues to undermine demand for the American currency ahead of the weekly close. EUR/USD hovers around weekly highs just ahead of the 1.0900 figure.

EUR/USD News

GBP/USD reconquers 1.2500 with upbeat UK GDP

GBP/USD reconquers 1.2500 with upbeat UK GDP

Following BOE-inspired slump on Thursday, the British Pound changed course and trades around 1.2530. Better-than-anticipated UK GDP and a weaker USD behind the advance.

GBP/USD News

Gold resumes advance and trades above $2,370

Gold resumes advance and trades above $2,370

XAU/USD accelerated its recovery on Friday, as investors drop the USD. Dismal US employment-related figures revived hopes for a soon-to-come rate cut from the Fed.

Gold News

XRP tests support at $0.50 as Ripple joins alliance to work on blockchain recovery

XRP tests support at $0.50 as Ripple joins alliance to work on blockchain recovery

XRP trades around $0.5174 early on Friday, wiping out gains from earlier in the week, as Ripple announced it has joined an alliance to support digital asset recovery alongside Hedera and the Algorand Foundation. 

Read more

Euro area annual inflation is expected to be 2.4% in April 2024

Euro area annual inflation is expected to be 2.4% in April 2024

Euro area annual inflation is expected to be 2.4% in April 2024, stable compared to March. Looking at the main components of euro area inflation, services is expected to have the highest annual rate in April.

Read more

Forex MAJORS

Cryptocurrencies

Signatures