|

EUR/USD Price Analysis: Bears lurking at daily resistance

  • EUR/USD has shot up to test a critical daily resistance area.
  • DXY below a critical level of support, now turned resistance. 

The Euro has been outperforming as the greenback crumbles to below critical areas of support on the daily charts. 

DXY daily chart

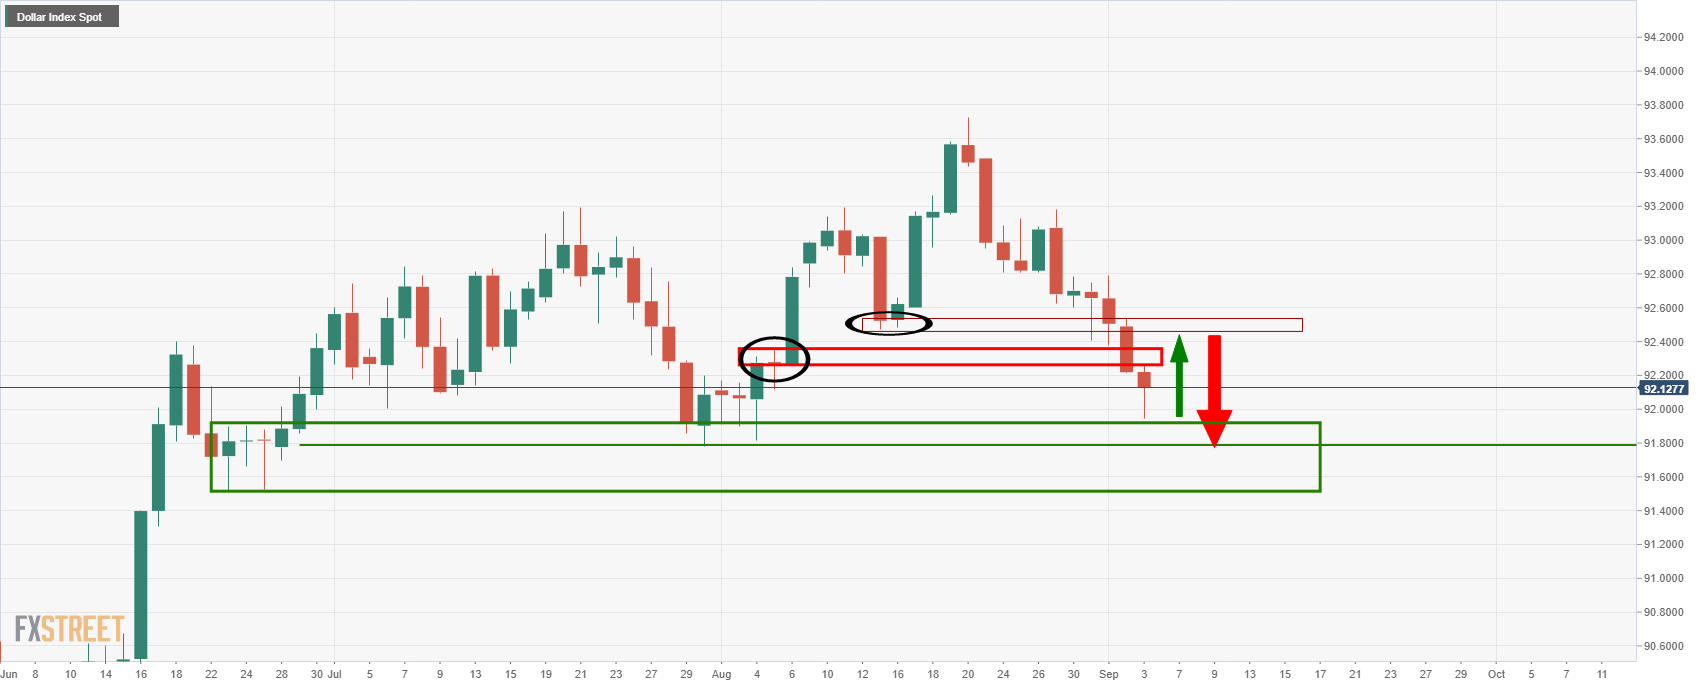
As illustrated, the price broke the 13 Aug low as well as the 5 Aug structure which exposes 91.80 and lower for a deeper test of demand territory for the days or weeks ahead. 

The following illustrates, however, a corrective scenario in the euro from daily resistance. 

Daily chart

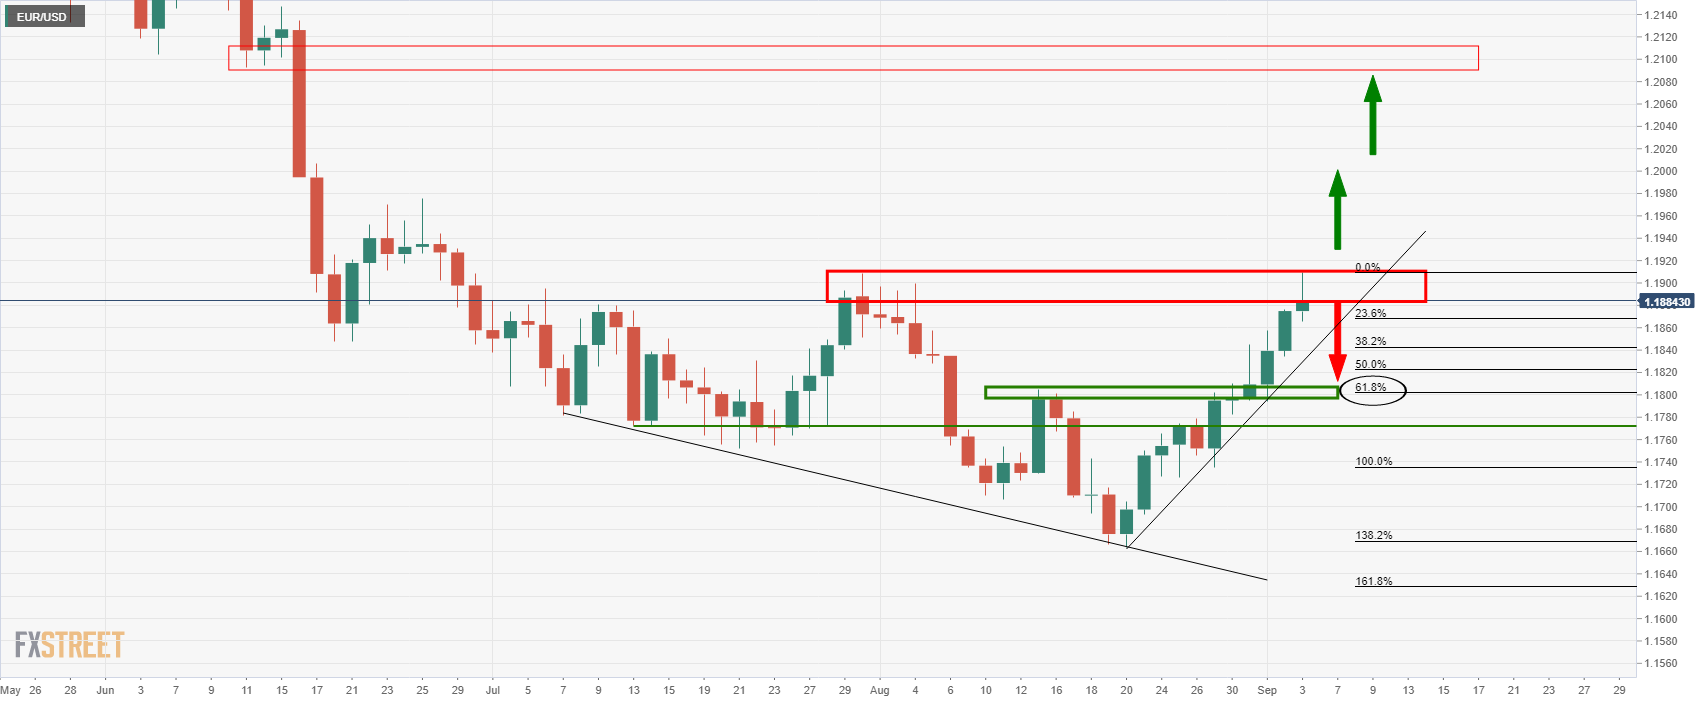
The price is meeting resistance in the 1.1880/00s which puts a focus on the downside for a meanwhile correction. 

The prior level of resistance, near 1.18 the figure, could be targeted on a restest. 

This also aligns with the 61.8% Fibonacci retracement level. 

4-hour chart

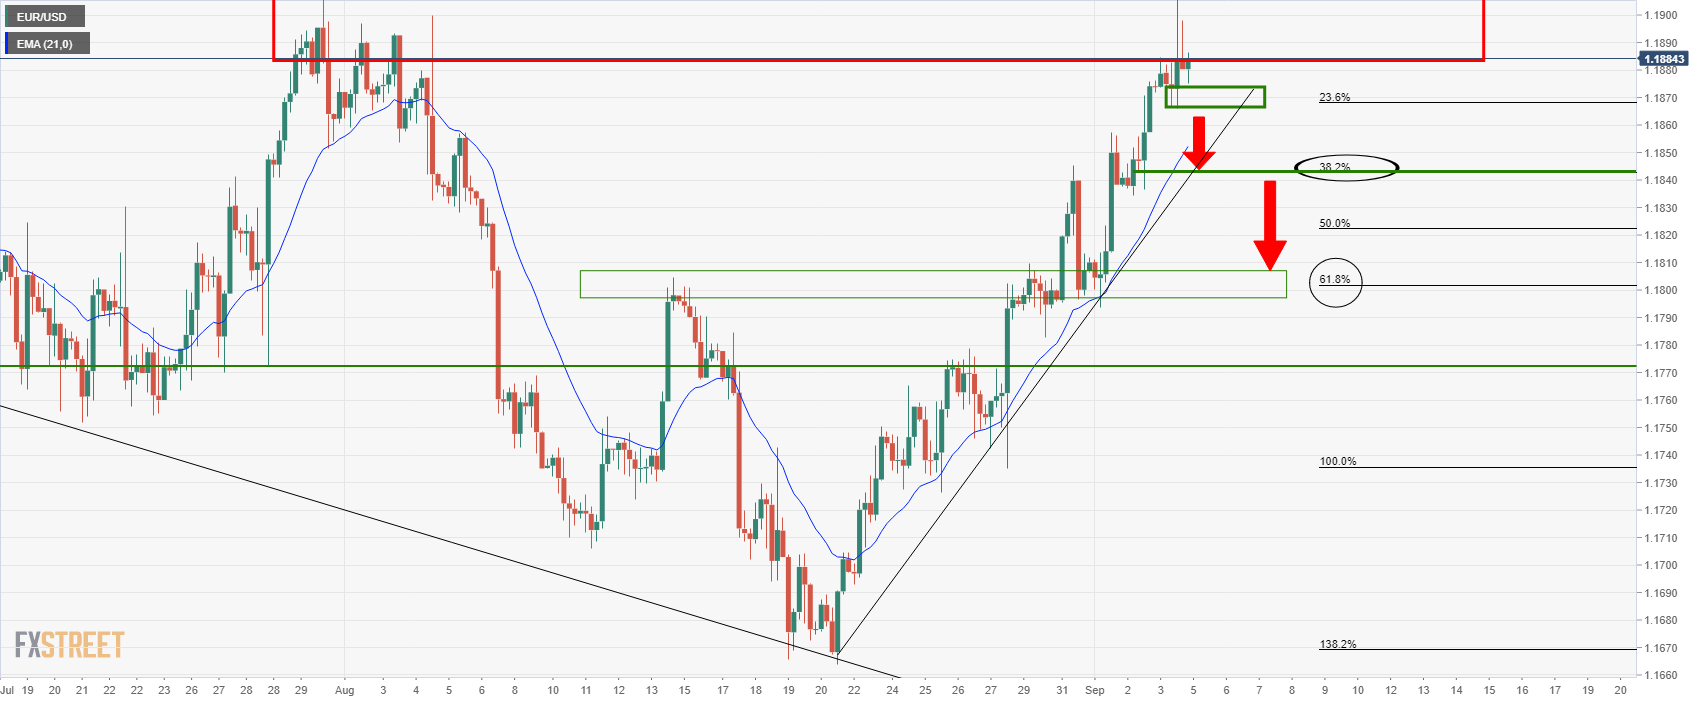
On the lower time frames, there are a number of structures for the bear to contend with first. 

The first area of support comes in as the daily 38.2% Fibonacci retracement near 1.1845 which has a confluence with the 21-EMA.

A break there opens the prospects of a test of the dynamic daily support and a subsequent follow-through opens the path to the 61.8% target. 

Author

Ross J Burland

Ross J Burland, born in England, UK, is a sportsman at heart. He played Rugby and Judo for his county, Kent and the South East of England Rugby team.

More from Ross J Burland
Share:

Markets move fast. We move first.

Orange Juice Newsletter brings you expert driven insights - not headlines. Every day on your inbox.

By subscribing you agree to our Terms and conditions.

Editor's Picks

EUR/USD meets some support near 1.1670

EUR/USD further extends its bearish leg on Wednesday, coming under extra pressure and breaching below the 1.1700 level to flirt with four-week troughs in a context of marginal gains in the US Dollar ahead of the key US NFP on Friday.

GBP/USD deflates to daily lows near 1.3470

GBP/USD stays under pressure on Wednesday, dipping to fresh lows around 1.3470 and extending the pullback that began the previous session. Cable remains on the defensive, with the US Dollar nudging slightly higher in the wake of key US December data.

Gold remains offered near $4,450

Gold remains on the back foot on Wednesday, hovering around $4,450 per troy ounce after bringing a three-day rally to an end. The metal’s advance seems to have run out of steam near the $4,500 area, with a firmer US Dollar after key US data weighing on prices. Still, the downside looks limited for now, thanks to falling US Treasury yields across the curve.

XRP faces selling pressure as key on-chain metric resets and ETF inflows weaken

Ripple (XRP) is trading downward but holding support at $2.22 at the time of writing on Wednesday, as fear spreads across the cryptocurrency market, reversing gains made from the start of the year.

2026 economic outlook: Clear skies but don’t unfasten your seatbelts yet

Most years fade into the background as soon as a new one starts. Not 2025: a year of epochal shifts, in which the macroeconomy was the dog that did not bark. What to expect in 2026? The shocks of 2025 will not be undone, but neither will they be repeated.

XRP battles selling pressure as profit-taking, ETF inflows shape outlook

Ripple (XRP) is trading downward but holding support at $2.22 at the time of writing on Wednesday, as fear spreads across the cryptocurrency market, reversing gains made from the start of the year.