EUR/USD continues sideways grind as markets await key US PCE inflation numbers
- EUR/USD drifted below 1.0800 after EU sentiment missed the mark.
- US GDP came in mixed, driving EUR/USD back to baseline.
- US PCE inflation to be the key data release this week.

EUR/USD sagged early Friday after European sentiment indicators came in below expectations, and a lopsided print in US Gross Domestic Product (GDP) figures kept the pair in familiar territory midweek.
Thursday brings plenty of data for investors to chew on with German Retail Sales and Consumer Price Index (CPI) numbers, which will be closely followed by US Personal Consumption Expenditure Price Index (PCE) inflation. Friday will round out the week with pan-European Harmonized Index of Consumer Prices (HICP) inflation, as well as the US ISM Manufacturing Purchasing Managers Index (PMI) for February.
Daily digest market movers: EUR/USD churns near 1.0800 once again on mixed data
- Europe’s Economic Sentiment Indicator fell to 95.4 in February versus the expected 96.7. January printed at 96.1 after a slight revision from 96.2.
- US QOQ Q4 GDP printed at 1.7%, above the forecast of 1.5%.
- Despite the QoQ increase, Q4’s annualized US GDP slipped back to 3.2% versus the forecast of 3.3% after downside revisions to 2023’s first-quarter growth.
- German Retail Sales are expected to recover slightly, forecast to print at -1.5% YoY compared to the previous period’s -1.7%.
- Germany’s YoY CPI is forecast to come in at 2.6%, down from the previous 2.9%.
- February’s Core annualized US PCE is expected to come in at 2.8% YoY versus the previous print of 2.9%.
Euro price this week
The table below shows the percentage change of Euro (EUR) against listed major currencies this week. Euro was the weakest against the Swiss Franc.
| USD | EUR | GBP | CAD | AUD | JPY | NZD | CHF | |
| USD | -0.18% | 0.09% | 0.50% | 1.05% | 0.05% | 1.40% | -0.30% | |
| EUR | 0.18% | 0.28% | 0.68% | 1.23% | 0.24% | 1.57% | -0.13% | |
| GBP | -0.09% | -0.27% | 0.42% | 0.96% | -0.04% | 1.31% | -0.40% | |
| CAD | -0.51% | -0.70% | -0.42% | 0.55% | -0.46% | 0.90% | -0.82% | |
| AUD | -1.08% | -1.25% | -0.98% | -0.55% | -1.00% | 0.35% | -1.37% | |
| JPY | -0.06% | -0.24% | 0.07% | 0.45% | 1.00% | 1.35% | -0.37% | |
| NZD | -1.42% | -1.59% | -1.31% | -0.90% | -0.34% | -1.35% | -1.72% | |
| CHF | 0.31% | 0.12% | 0.39% | 0.81% | 1.36% | 0.36% | 1.70% |
The heat map shows percentage changes of major currencies against each other. The base currency is picked from the left column, while the quote currency is picked from the top row. For example, if you pick the Euro from the left column and move along the horizontal line to the Japanese Yen, the percentage change displayed in the box will represent EUR (base)/JPY (quote).
Technical analysis: EUR/USD continues to drift around 1.0800
EUR/USD fell to an intraday low of 1.0796 before recovering into familiar technical churn as the pair cycles 1.0800. The 1.0840 level is the pair’s key sticking point on Wednesday. A heavy supply zone is priced in between 1.0860 and 1.0840.
Daily candlesticks remain hamstrung on the 200-day Simple Moving Average (SMA) near 1.0830, and the EUR/USD continues to drift into median bids despite a bullish recovery from the last swing low into 1.0700. The pair remains down nearly 3% from December’s peak at 1.1140.
EUR/USD hourly chart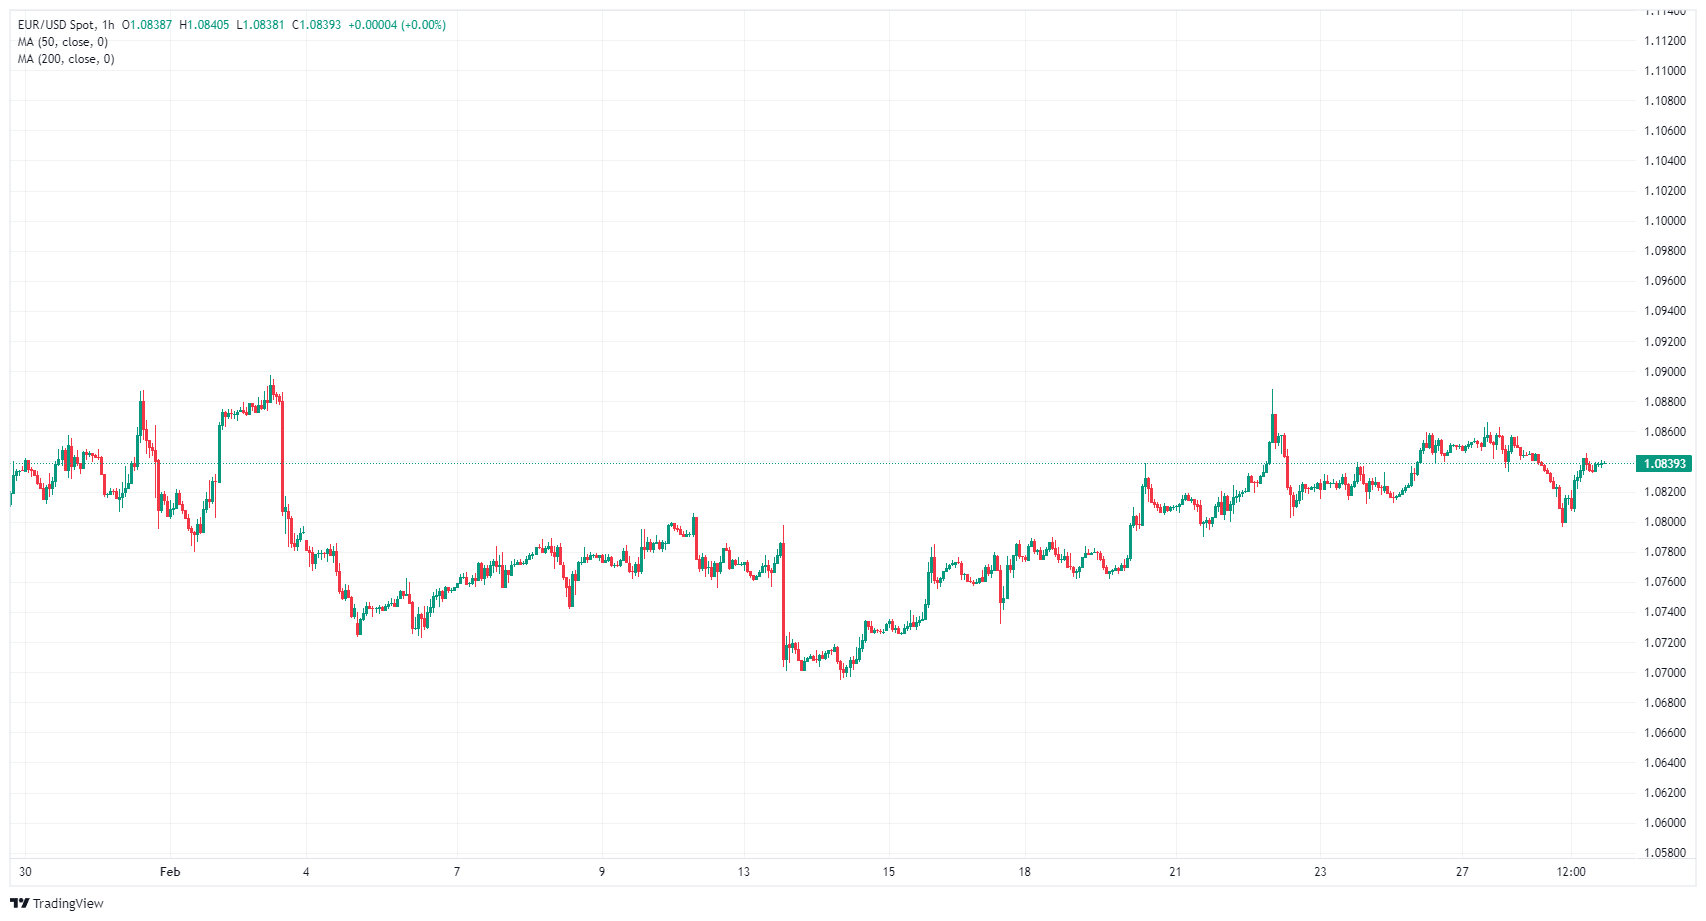
EUR/USD daily chart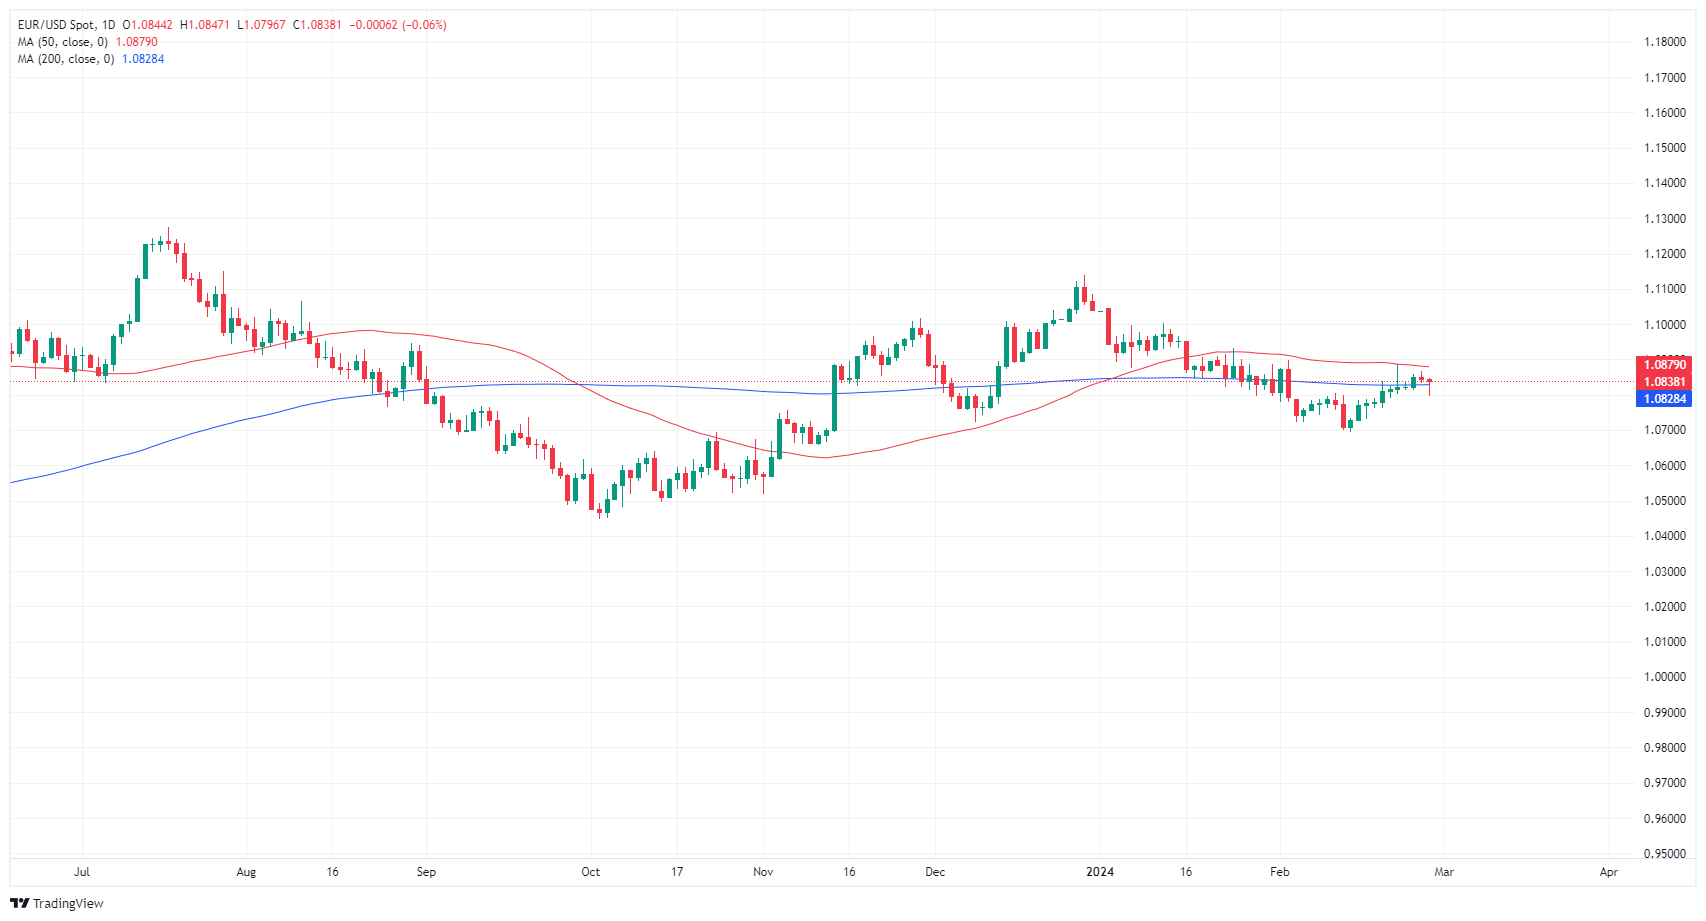
Euro FAQs
What is the Euro?
The Euro is the currency for the 20 European Union countries that belong to the Eurozone. It is the second most heavily traded currency in the world behind the US Dollar. In 2022, it accounted for 31% of all foreign exchange transactions, with an average daily turnover of over $2.2 trillion a day.
EUR/USD is the most heavily traded currency pair in the world, accounting for an estimated 30% off all transactions, followed by EUR/JPY (4%), EUR/GBP (3%) and EUR/AUD (2%).
What is the ECB and how does it impact the Euro?
The European Central Bank (ECB) in Frankfurt, Germany, is the reserve bank for the Eurozone. The ECB sets interest rates and manages monetary policy.
The ECB’s primary mandate is to maintain price stability, which means either controlling inflation or stimulating growth. Its primary tool is the raising or lowering of interest rates. Relatively high interest rates – or the expectation of higher rates – will usually benefit the Euro and vice versa.
The ECB Governing Council makes monetary policy decisions at meetings held eight times a year. Decisions are made by heads of the Eurozone national banks and six permanent members, including the President of the ECB, Christine Lagarde.
How does inflation data impact the value of the Euro?
Eurozone inflation data, measured by the Harmonized Index of Consumer Prices (HICP), is an important econometric for the Euro. If inflation rises more than expected, especially if above the ECB’s 2% target, it obliges the ECB to raise interest rates to bring it back under control.
Relatively high interest rates compared to its counterparts will usually benefit the Euro, as it makes the region more attractive as a place for global investors to park their money.
How does economic data influence the value of the Euro?
Data releases gauge the health of the economy and can impact on the Euro. Indicators such as GDP, Manufacturing and Services PMIs, employment, and consumer sentiment surveys can all influence the direction of the single currency.
A strong economy is good for the Euro. Not only does it attract more foreign investment but it may encourage the ECB to put up interest rates, which will directly strengthen the Euro. Otherwise, if economic data is weak, the Euro is likely to fall.
Economic data for the four largest economies in the euro area (Germany, France, Italy and Spain) are especially significant, as they account for 75% of the Eurozone’s economy.
How does the Trade Balance impact the Euro?
Another significant data release for the Euro is the Trade Balance. This indicator measures the difference between what a country earns from its exports and what it spends on imports over a given period.
If a country produces highly sought after exports then its currency will gain in value purely from the extra demand created from foreign buyers seeking to purchase these goods. Therefore, a positive net Trade Balance strengthens a currency and vice versa for a negative balance.
Author

Joshua Gibson
FXStreet
Joshua joins the FXStreet team as an Economics and Finance double major from Vancouver Island University with twelve years' experience as an independent trader focusing on technical analysis.


