|

EUR/USD: Downside opens up towards 1.2000 as King dollar rules – Confluence Detector

EUR/USD is moving back and forth in a familiar range around 1.2100, lacking a clear directional bias. The upside appears elusive as the US dollar holds onto the recent advance, triggered by upbeat US CPI data. The risk sentiment looks heavier on the session, keeping the safe-haven dollar on the front. However, the major could find some reprieve from the retreat in the US Treasury yields.

How is EUR//USD positioned on the technical graphs?

EUR/USD Price Chart: Key resistance and support levels

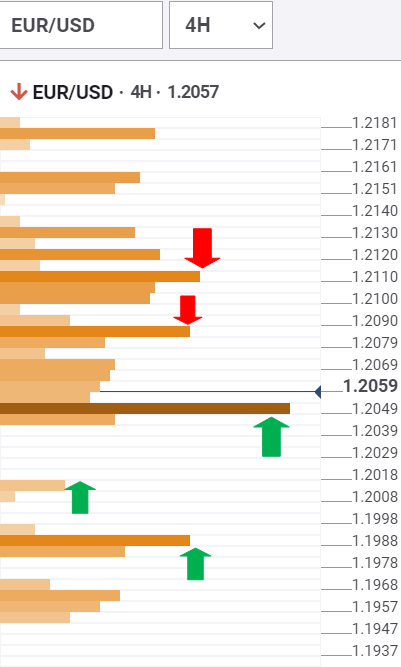
The Technical Confluences Detector shows that EUR/USD is poised to challenge critical support at 1.2049, where the SMA100 one-day converges with the Fibonacci 23.6% one-month and pivot point one-week S1.

A sustained move below the latter could fuel a steep drop towards 1.2015, which is the pivot point one-day S2.

The next relevant support is seen at the confluence of the previous week low and the Fibonacci 38.2% one-month, now placed around 1.1990.

On the flip side, immediate resistance awaits at 1.2090, the intersection of the SMA10 one-day and SMA50 four-hour.

The EUR bulls need to recapture the previous high four-hour at 1.2107 in order to revive the recovery momentum from Wednesday’s slide.

Further up, the 1.2120 upside barrier could challenge the bullish commitments. That level is the confluence of the SMA5 one-day, Fibonacci 61.8% one-day and SMA50 one-hour.

Here is how it looks on the tool       
fxsoriginal

About Technical Confluences Detector

The TCD (Technical Confluences Detector) is a tool to locate and point out those price levels where there is a congestion of indicators, moving averages, Fibonacci levels, Pivot Points, etc. Knowing where these congestion points are located is very useful for the trader, and can be used as a basis for different strategies.

Author

Dhwani Mehta

Dhwani Mehta

FXStreet

Residing in Mumbai (India), Dhwani is a Senior Analyst and Manager of the Asian session at FXStreet. She has over 10 years of experience in analyzing and covering the global financial markets, with specialization in Forex and commodities markets.


More from Dhwani Mehta
Share:

Editor's Picks

AUD/USD defies gravity; focus is back to 0.7000

AUD/USD has maintained its bid bias around 0.6970 ahead of the opening bell in Asia on Tuesday. The pair has added to Friday’s rebound, retargeting the 0.7000 hurdle despite another day of firm gains in the Greenback. Looking ahead, Westpac will publish its Consumer Confidence gauge on the domestic calendar.

USD/JPY retakes 158.00 amid hawkish BoJ bets, firmer USD

USD/JPY erases losses and retakes 158.00 in the Asian session on Monday, trading within a one-week-old range. Geopolitical uncertainty continues to underpin the US Dollar, despite fading Fed rate hike hopes, supporting the pair's rebound. However, further upside could be capped by hawkish BoJ expectations and looming intervention risks that could support the Japanese Yen.

Gold treads water around $4,150

Gold now regains some composure and approaches the $4,150 mark per troy ounce late on Monday. The precious metal’s vacillating price action comes in response to the persistent advance in the US Dollar in combination with the resurgence of the upside momentum in US Treasury yields across the curve.

Bitcoin and Gold Outlook: BTC slips, XAU downtrend persists as US Services PMI misses forecasts
Bitcoin (BTC) faces growing headwinds on Monday, as it trades lower below $86,000. Despite the ongoing pullback, the Crypto King remains in a broad range with the lower limit near $84,000 and the upper limit at $88,000. A break on either side of this zone would influence BTC's direction. Gold (XAU/USD), meanwhile, retains a dominant bearish outlook as price action continues downward toward $4,100.
Eurozone inflation just hit 3.8%, its highest in three years. This chart shows why the ECB can’t simply hike its way out

The ECB would normally have a relatively straightforward answer to inflation running almost twice its target: raise interest rates. But these are not normal circumstances. This time, the bond market is already doing part of the tightening for it, leaving the ECB facing an increasingly difficult dilemma.

Eurozone inflation just hit 3.8%, its highest in three years. This chart shows why the ECB can’t simply hike its way out

The ECB would normally have a relatively straightforward answer to inflation running almost twice its target: raise interest rates. But these are not normal circumstances. This time, the bond market is already doing part of the tightening for it, leaving the ECB facing an increasingly difficult dilemma.














