|

EUR/USD catches a Friday bid, looking to climb over 1.0950

  • The EUR/USD is seeing bids in a broad-market risk rally to close out the trading week.
  • Market sentiment is seeing a late break, pushing bids up the charts in a technical rally.
  • US PMI data came in mixed, helping to soften the US Dollar.

The EUR/USD is trading into the 1.0950 level as the trading week winds up and markets are set for an early volume drop-off with US money markets shuttering early for the weekend. US markets are set to close at 13:00 EST this week, and markets are taking one last step into a risk bid before the early bell.

US S&P Global Manufacturing PMI drops to 49.4 in October

US Purchasing Managers' Index (PMI) data spread on Friday, with a decline in the Manufacturing component and an uptick in the Services figures.

The US Manufacturing PMI backslid into 49.4, missing the market's forecast of 49.8 and slipping back into contraction territory in November after October's flat reading of 50.0.

The Services component expanded, printing at 50.8 versus the forecast decline from 50.6 to 50.4, helping to offset the decline in Manufacturing and keeping the Composite PMI figure on-balance at 50.7, matching October's print.

Market participants will be turning their attention towards next week's heftier data releases, with US Gross Domestic Product (GDP) and Eurozone Harmonized Index of Consumer Price (HICP) inflation figures, both due in the mid-week.

US QoQ GDP is expected to tick upwards from 4.9% to 5.0% and pan-Eurozone HICP inflation is expected to slow down from 4.2% to 3.9% for the annualized figure.

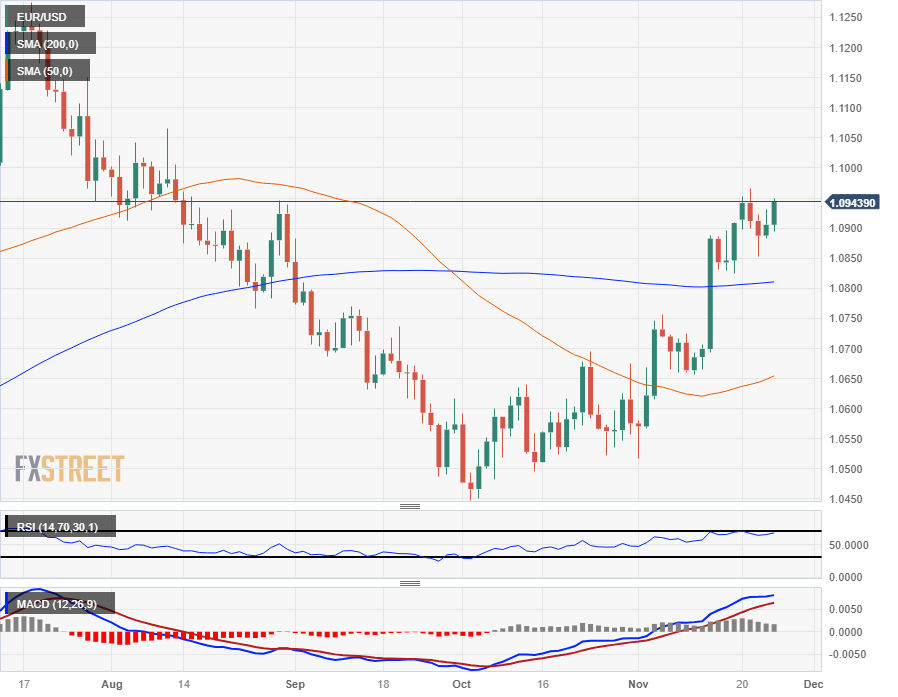
EUR/USD Technical Outlook

The Euro is grinding higher against the US Dollar heading into Friday's market close, with the EUR/USD pushing towards 1.0950, but the pair still remains below the week's peak at 1.0965.

The pair has rallied almost 5% from early October's bottom at 1.0448, and the pair has climbed three-tenths of a percent on the week. Friday's late technical rally helped to push the pair back into the green after reaching a weekly low near 1.0850.

EUR/USD Daily Chart

EUR/USD Technical Levels

EUR/USD

Overview
Today last price1.0945
Today Daily Change0.0039
Today Daily Change %0.36
Today daily open1.0906
 
Trends
Daily SMA201.0749
Daily SMA501.0649
Daily SMA1001.0793
Daily SMA2001.0809
 
Levels
Previous Daily High1.0931
Previous Daily Low1.0883
Previous Weekly High1.0909
Previous Weekly Low1.0665
Previous Monthly High1.0695
Previous Monthly Low1.0448
Daily Fibonacci 38.2%1.0913
Daily Fibonacci 61.8%1.0901
Daily Pivot Point S11.0882
Daily Pivot Point S21.0859
Daily Pivot Point S31.0834
Daily Pivot Point R11.093
Daily Pivot Point R21.0955
Daily Pivot Point R31.0978

Author

Joshua Gibson

Joshua joins the FXStreet team as an Economics and Finance double major from Vancouver Island University with twelve years' experience as an independent trader focusing on technical analysis.

More from Joshua Gibson
Share:

Markets move fast. We move first.

Orange Juice Newsletter brings you expert driven insights - not headlines. Every day on your inbox.

By subscribing you agree to our Terms and conditions.

Editor's Picks

EUR/USD remains below 1.1700 amid weakening momentum

EUR/USD remains steady after four days of losses, trading around 1.1680 during the Asian hours on Thursday. On the daily chart, the 14-day Relative Strength Index at 42.6 (neutral-bearish) indicates weakening momentum after slipping below the 50 midline. RSI staying sub-50 would keep bears engaged and limit recovery attempts.

GBP/USD consolidates above mid-1.3400s; bullish potential seems intact

The GBP/USD pair is seen consolidating its heavy losses registered over the past two days and oscillating in a narrow trading band, just above mid-1.3400s during the Asian session on Thursday. However, the fundamental backdrop warrants some caution for bearish traders and before positioning for an extension of the retracement slide from the 1.3565-1.3570 region, or the highest level since September 18, touched on Tuesday.

Gold: Deeper correction or dip-buying likely?

Gold is nursing losses near $4,450 in Asian trading on Thursday, having suffered about a 1% correction from weekly highs of $4,500 on Wednesday. All eyes remain on the geopolitical developments and the incoming US jobless claims data for fresh trading directives.

Top Crypto Losers: Pump.fun, Story, and Pudgy Penguins test key support levels

Pump.fun, Story, and Pudgy Penguins experience intense selling pressure over the last 24 hours. PUMP and IP failed to cross the 50-day Exponential Moving Average, resulting in a pullback on Wednesday, while PENGU is testing its 50-day EMA.

2026 economic outlook: Clear skies but don’t unfasten your seatbelts yet

Most years fade into the background as soon as a new one starts. Not 2025: a year of epochal shifts, in which the macroeconomy was the dog that did not bark. What to expect in 2026? The shocks of 2025 will not be undone, but neither will they be repeated.

XRP battles selling pressure as profit-taking, ETF inflows shape outlook

Ripple (XRP) is trading downward but holding support at $2.22 at the time of writing on Wednesday, as fear spreads across the cryptocurrency market, reversing gains made from the start of the year.