EUR/JPY technical analysis: Doji, 50-day EMA question bulls ahead of the ECB


  • EUR/JPY again confronts 50-day EMA after registering a Doji candlestick formation on Wednesday.
  • The bearish formation gets confirmed on the pair’s break below 118.25.
  • An upside clearance of short-term EMA can aim for the 50% Fibonacci retracement level.

Despite trading near the highest levels in four-weeks, the EUR/JPY pair remains skeptical of further upside as it takes the bids to 119.00 ahead of the European session open on Thursday.

The Euro traders are awaiting the key event, namely monetary policy meeting by the European Central Bank (ECB), with most expecting a heavily dovish outcome as the President Mario Draghi will be heading the policymakers for the second-last time before he leaves the boat in October.

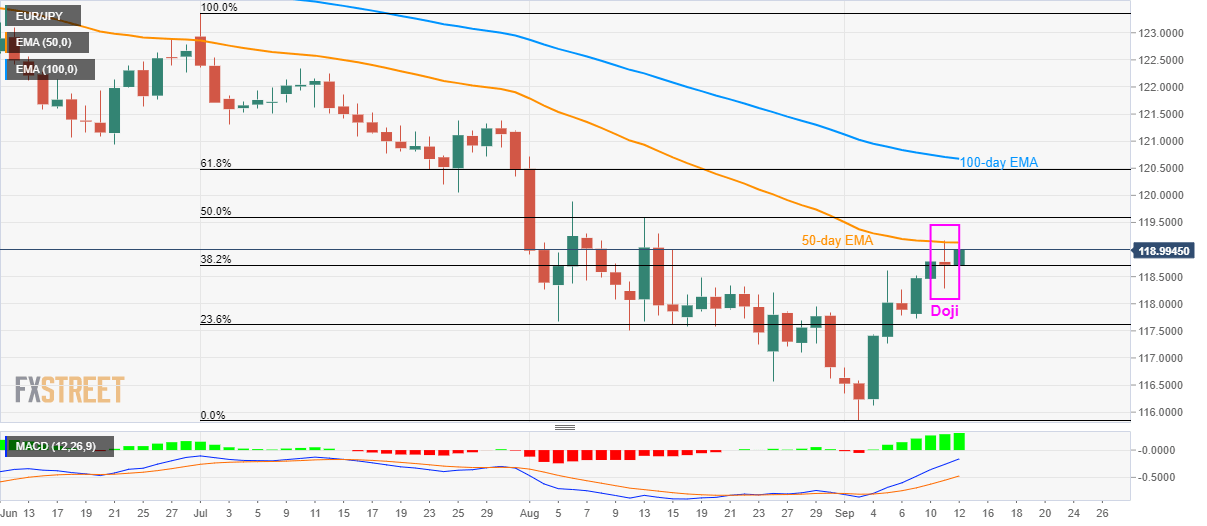
The negatives are pair’s trading below the 50-day exponential moving average (EMA) following Wednesday’s Doji candle formation on the daily chart.

As a result, sellers are waiting for a downside break below Tuesday’s low surrounding 118.25 in order to target 23.6% Fibonacci retracement level of July-September declines, near 117.60. Further, pair’s south-run past-117.60 can please sellers with a late-August low near 116.60 ahead of offering current month’s bottom around 115.85.

On the upside, pair’s successful break above 50-day EMA level of 119.13 could further escalate the recovery towards 50% Fibonacci retracement level of 119.60 and then to 120.00 round-figure. Additionally, 61.8% Fibonacci retracement and 100-day EMA, around 120.50 and 120.70 respectively, will entertain bulls afterward.

EUR/JPY daily chart

Trend: pullback expected

additional important levels

Overview
Today last price 119.01
Today Daily Change 29 pips
Today Daily Change % 0.24%
Today daily open 118.72
 
Trends
Daily SMA20 117.74
Daily SMA50 119.34
Daily SMA100 121.01
Daily SMA200 123.32
Levels
Previous Daily High 119.18
Previous Daily Low 118.29
Previous Weekly High 118.62
Previous Weekly Low 115.86
Previous Monthly High 120.72
Previous Monthly Low 116.57
Daily Fibonacci 38.2% 118.63
Daily Fibonacci 61.8% 118.84
Daily Pivot Point S1 118.28
Daily Pivot Point S2 117.84
Daily Pivot Point S3 117.4
Daily Pivot Point R1 119.17
Daily Pivot Point R2 119.61
Daily Pivot Point R3 120.05


Share: Feed news

Information on these pages contains forward-looking statements that involve risks and uncertainties. Markets and instruments profiled on this page are for informational purposes only and should not in any way come across as a recommendation to buy or sell in these assets. You should do your own thorough research before making any investment decisions. FXStreet does not in any way guarantee that this information is free from mistakes, errors, or material misstatements. It also does not guarantee that this information is of a timely nature. Investing in Open Markets involves a great deal of risk, including the loss of all or a portion of your investment, as well as emotional distress. All risks, losses and costs associated with investing, including total loss of principal, are your responsibility. The views and opinions expressed in this article are those of the authors and do not necessarily reflect the official policy or position of FXStreet nor its advertisers. The author will not be held responsible for information that is found at the end of links posted on this page.

If not otherwise explicitly mentioned in the body of the article, at the time of writing, the author has no position in any stock mentioned in this article and no business relationship with any company mentioned. The author has not received compensation for writing this article, other than from FXStreet.

FXStreet and the author do not provide personalized recommendations. The author makes no representations as to the accuracy, completeness, or suitability of this information. FXStreet and the author will not be liable for any errors, omissions or any losses, injuries or damages arising from this information and its display or use. Errors and omissions excepted.

The author and FXStreet are not registered investment advisors and nothing in this article is intended to be investment advice.

Recommended content


Recommended content

Editors’ Picks

How will US Dollar react to April jobs report? – LIVE

How will US Dollar react to April jobs report? – LIVE

Following the Fed's policy announcements, market focus shifts to the April jobs report from the US. Nonfarm Payrolls are forecast to rise 238K. Investors will also pay close attention to revisions and wage inflation figures.

FOLLOW US LIVE

EUR/USD clings to gains near 1.0750 ahead of US jobs report

EUR/USD clings to gains near 1.0750 ahead of US jobs report

EUR/USD clings to modest gains at around 1.0750 after closing the previous two days in positive territory. Investors eagerly await April jobs report from the US, which will include Nonfarm Payrolls and Unemployment Rate readings.

EUR/USD News

GBP/USD advances to 1.2550, all eyes on US NFP data

GBP/USD advances to 1.2550, all eyes on US NFP data

The GBP/USD pair trades on a stronger note around 1.2550 amid the softer US Dollar on Friday. Market participants refrain from taking large positions as focus shifts to April Nonfarm Payrolls and ISM Services PMI data from the US.

GBP/USD News

Gold remains stuck near $2,300 ahead of US NFP

Gold remains stuck near $2,300 ahead of US NFP

Gold price struggles to gain any meaningful traction and trades in a tight channel near $2,300. The Fed’s less hawkish outlook drags the USD to a multi-week low and lends support to XAU/USD ahead of the key US NFP data.

Gold News

XRP edges up after week-long decline as Ripple files letter in reply to SEC’s motion

XRP edges up after week-long decline as Ripple files letter in reply to SEC’s motion

Ripple filed a letter to the court to support its April 22 motion to strike new expert materials. The legal clash concerns whether SEC accountant Andrea Fox's testimony should be treated as a summary or expert witness. 

Read more

Forex MAJORS

Cryptocurrencies

Signatures