EUR/JPY technical analysis: 61.8% Fibo. offers nearby rest ahead of 118.92/85 support-zone
- EUR/JPY sellers cheer the quote’s trading below 50% Fibonacci retracement.
- 61.8% Fibonacci retracement and the key horizontal region become crucial to watch.

Sustained trading below 50% Fibonacci retracement signals the EUR/JPY pair’s further declines as it trades near 120.66 during Wednesday morning in Asia.
While 61.8% Fibonacci retracement of 2016 swing lows to 2018 swing highs, at 120.16, seems almost given, 120.00 round-figure and 118.92/85 support-area comprising current year low and late-April 2017 bottom could confine the pair’s further south-run.
Nearly oversold conditionals of 14-bar relative strength index (RSI) also question the pair’s heavy declines.
On the contrary, 121.00 and a three-week-old descending trend-line at 121.26 can keep limiting the pair’s upside attempts, a break of which can trigger fresh advances to 122.00, 122.34 and the monthly high surrounding 123.36.
EUR/JPY weekly chart
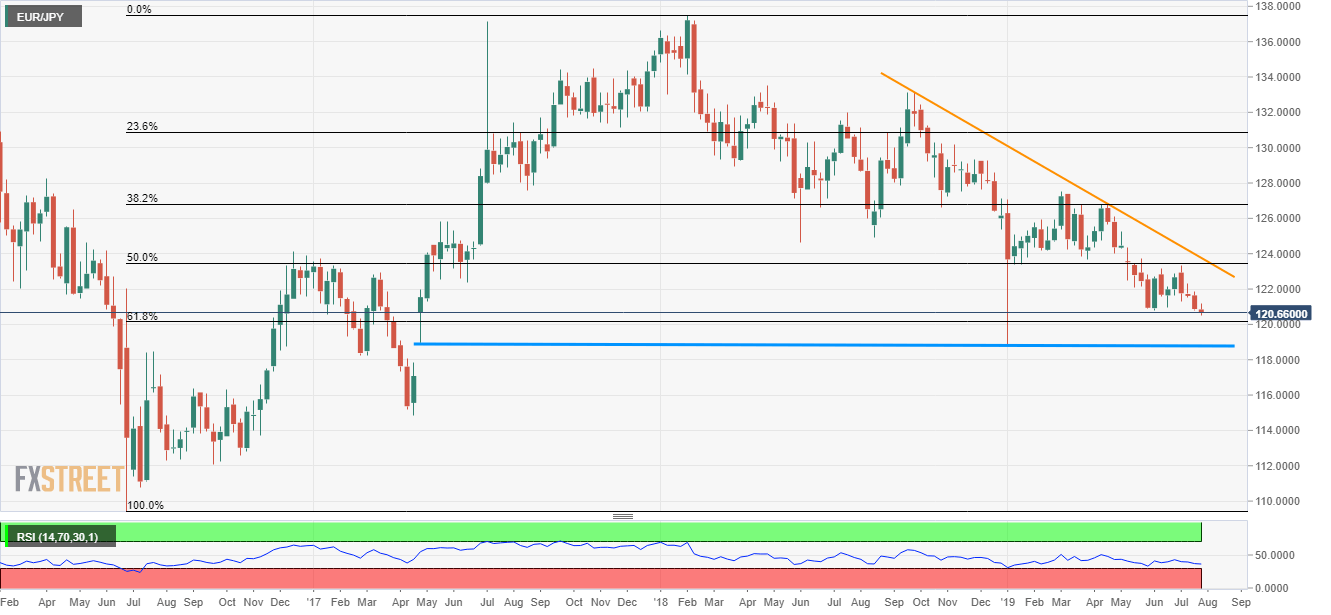
Trend: Bearish
Author

Anil Panchal
FXStreet
Anil Panchal has nearly 15 years of experience in tracking financial markets. With a keen interest in macroeconomics, Anil aptly tracks global news/updates and stays well-informed about the global financial moves and their implications.


