|

EUR/JPY Price Analysis: Rallies for seventh straight day as bulls target 170.00

  • EUR/JPY edges up 0.44%, extending its winning streak to seven days amid positive market sentiment.
  • Technical outlook remains bullish; RSI nears overbought territory, indicating strong upward momentum.
  • Watch resistance at April’s 26 high of 169.39, 170.00, and YTD high at 171.58.
  • Key support levels at 169.00, 166.93/81, and 165.90.

During the North American session, the Euro prolonged its gains versus the Japanese Yen in late trading. Market sentiment remains upbeat; hence, the EUR/JPY trades with gains of 0.44%, at 169.27 at the time of writing.

EUR/JPY Price Analysis: Technical outlook

From a technical perspective, the EUR/JPY remains upward biased, extending its gains for seven straight days, whereas fears that Japanese authorities could intervene in the Forex markets can limit the upside.

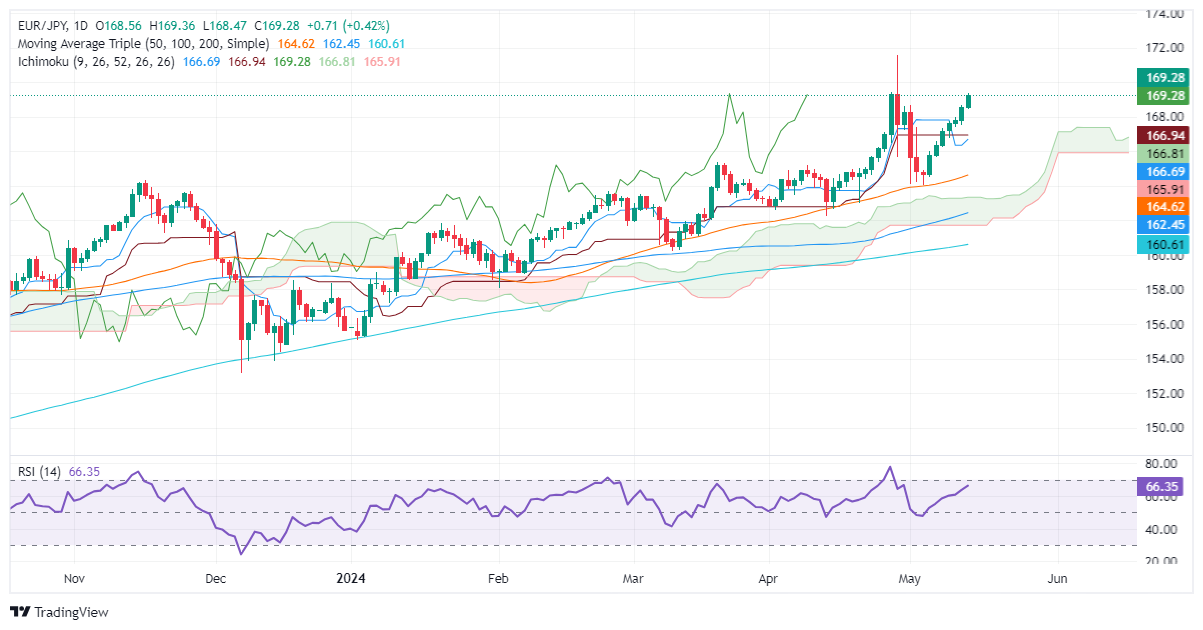
Momentum remains favoring the uptrend, as the Relative Strength Index is in bullish territory and about to become overbought. However, due to the strength of the uptrend, the most extreme level wouldn’t be 70, as most traders would use 80.

With that said, the first key resistance level would be the April 26 high at 169.39. Once surpassed, sellers' next line of defense would be the 170.00 figure, followed by the year-to-date (YTD) high at 171.58.

Conversely, if EUR/JPY retreats and dives below 169.00, that could exert downward pressure on the cross. The first support level would be the confluence of the Kijun-Sen and the Senkou Span A at around 166.93/81, followed by the Tenkan-Sen at 166.68. A breach of the latter will expose the Senkou Span B at 165.90.

EUR/JPY Price Action – Daily Chart

EUR/JPY

Overview
Today last price169.26
Today Daily Change0.70
Today Daily Change %0.42
Today daily open168.56
 
Trends
Daily SMA20166.3
Daily SMA50164.49
Daily SMA100162.33
Daily SMA200160.55
 
Levels
Previous Daily High168.66
Previous Daily Low167.51
Previous Weekly High167.97
Previous Weekly Low164.48
Previous Monthly High171.6
Previous Monthly Low162.28
Daily Fibonacci 38.2%168.22
Daily Fibonacci 61.8%167.95
Daily Pivot Point S1167.83
Daily Pivot Point S2167.1
Daily Pivot Point S3166.68
Daily Pivot Point R1168.98
Daily Pivot Point R2169.39
Daily Pivot Point R3170.12

Author

Christian Borjon Valencia

Christian Borjon began his career as a retail trader in 2010, mainly focused on technical analysis and strategies around it. He started as a swing trader, as he used to work in another industry unrelated to the financial markets.

More from Christian Borjon Valencia
Share:

Markets move fast. We move first.

Orange Juice Newsletter brings you expert driven insights - not headlines. Every day on your inbox.

By subscribing you agree to our Terms and conditions.

Editor's Picks

EUR/USD trades around 1.1700 after rebounding from 50-day EMA

EUR/USD gains ground after three days of losses, trading around 1.1700 during the Asian hours on Wednesday. On the daily chart, technical analysis indicates a potential for a bearish bias; the 14-day Relative Strength Index at 47 confirms waning momentum.

GBP/USD climbs above 1.3500 as US Dollar weakens ahead of ISM Services PMI

GBP/USD gains some ground after registering modest gains in the previous session, trading around 1.3510 during the Asian hours on Wednesday. The pair edges higher as the US Dollar struggles ahead of the US ISM Services Purchasing Managers’ Index and JOLTs job openings due later in the day.

Gold pulls back from $4,500 amid profit-taking ahead of key US macro data

Gold struggles to capitalize on its strong weekly gains registered over the past two days and faces rejection near the $4,500 psychological mark, or over a one-week high touched during the Asian session on Wednesday. As investors digest the recent US attack on Venezuela, the prevalent risk-on environment prompts some profit-taking around the commodity. 

Bitcoin, Ethereum and Ripple cool off as rally stalls near key resistance zones

Bitcoin, Ethereum, and Ripple prices are taking a breather on Wednesday near their key resistance levels following the recent surge. BTC faces rejection at the $94,253 level, while ETH and XRP follow BTC’s footsteps, struggling near $3,308 and $2.35, respectively.

Implications of US intervention in Venezuela

Events in Venezuela are top of mind for market participants, and while developments are associated with an elevated degree of uncertainty, we are not making any changes to our markets or economic forecasts as a result of the deposition of Nicolás Maduro. 

Aave Price Forecast: AAVE eyes bullish breakout as on-chain and derivatives data turns supportive

Aave (AAVE) price hovers around $172 on Wednesday, nearing the upper trendline of the falling parallel channel pattern. A break above this technical pattern favors the bulls.