EUR/JPY Price Analysis: Bounces off three-week-old support line, 200-EMA


  • EUR/JPY rebounds from short-term key support confluence amid sluggish markets.
  • Unimpressive oscillators, descending trend line from late December challenge buyers.
  • Multiple hurdles to probe bears past 140.40-30 support confluence.

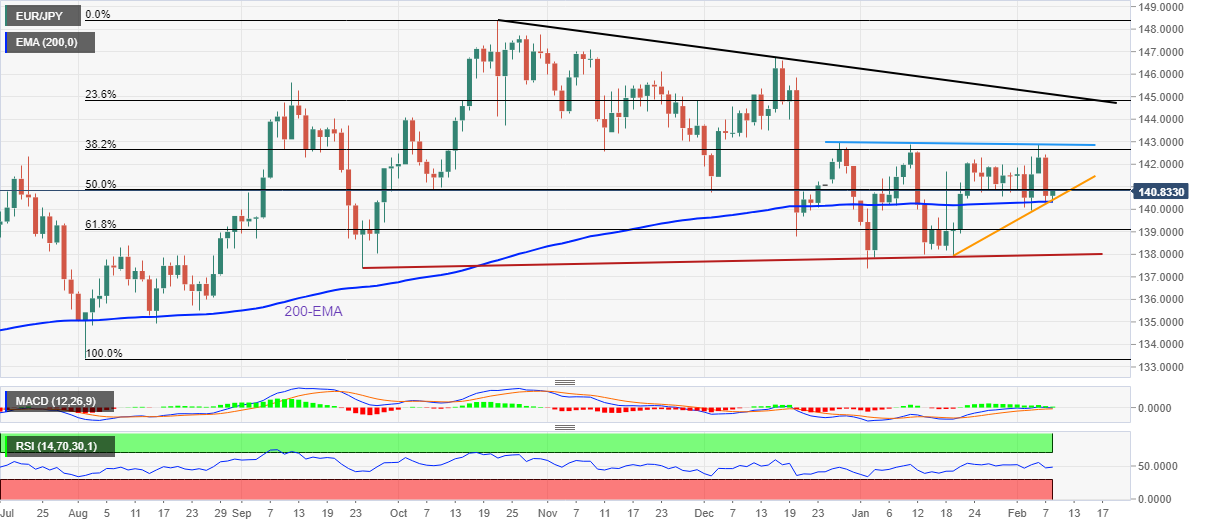
EUR/JPY picks up bids to 140.80 while paring the biggest daily loss in nearly a month during Wednesday’s sluggish Asian session. In doing so, the cross-currency pair bounces off a convergence of the 200-day Exponential Moving Average (EMA) and an upward-sloping support line from January 19, 2023, close to 140.40-30 at the latest.

The recovery moves, however, gain little support from the oscillators as the RSI (14) remains steady while the MACD signals are mostly sluggish.

Even so, a corrective rebound from important support towards 141.00 rounds figure can’t be ruled out.

Following that, a six-week-old descending resistance line, close to 142.90 by the press time, will gain the EUR/JPY pair buyer’s attention.

Should the quote manage to stay firmer past 142.90, the 143.00 round figure may act as an extra validation point ahead of portraying the pair’s gradual run-up targeting a descending resistance line from October 2022, around 145.20 at the latest.

Alternatively, a daily closing below the 140.40-30 support confluence, could quickly drag the EUR/JPY price towards the 61.8% Fibonacci retracement level of the pair’s August-October 2022 upside, near 139.10. During the fall, the 140.00 round figure may offer breathing space to the bears.

It’s worth noting, however, that the EUR/JPY weakness past 139.10 could make it vulnerable to testing an ascending support line from late September 2022, near 138.00 at the latest.

EUR/JPY: Daily chart

Trend: Limited recovery expected

Additional important levels

Overview
Today last price 140.73
Today Daily Change 0.13
Today Daily Change % 0.09%
Today daily open 140.6
 
Trends
Daily SMA20 140.76
Daily SMA50 141.68
Daily SMA100 142.94
Daily SMA200 141.02
 
Levels
Previous Daily High 142.44
Previous Daily Low 140.29
Previous Weekly High 142.34
Previous Weekly Low 139.93
Previous Monthly High 142.86
Previous Monthly Low 137.39
Daily Fibonacci 38.2% 141.11
Daily Fibonacci 61.8% 141.62
Daily Pivot Point S1 139.78
Daily Pivot Point S2 138.96
Daily Pivot Point S3 137.62
Daily Pivot Point R1 141.93
Daily Pivot Point R2 143.26
Daily Pivot Point R3 144.08


Share: Feed news

Information on these pages contains forward-looking statements that involve risks and uncertainties. Markets and instruments profiled on this page are for informational purposes only and should not in any way come across as a recommendation to buy or sell in these assets. You should do your own thorough research before making any investment decisions. FXStreet does not in any way guarantee that this information is free from mistakes, errors, or material misstatements. It also does not guarantee that this information is of a timely nature. Investing in Open Markets involves a great deal of risk, including the loss of all or a portion of your investment, as well as emotional distress. All risks, losses and costs associated with investing, including total loss of principal, are your responsibility. The views and opinions expressed in this article are those of the authors and do not necessarily reflect the official policy or position of FXStreet nor its advertisers. The author will not be held responsible for information that is found at the end of links posted on this page.

If not otherwise explicitly mentioned in the body of the article, at the time of writing, the author has no position in any stock mentioned in this article and no business relationship with any company mentioned. The author has not received compensation for writing this article, other than from FXStreet.

FXStreet and the author do not provide personalized recommendations. The author makes no representations as to the accuracy, completeness, or suitability of this information. FXStreet and the author will not be liable for any errors, omissions or any losses, injuries or damages arising from this information and its display or use. Errors and omissions excepted.

The author and FXStreet are not registered investment advisors and nothing in this article is intended to be investment advice.

Recommended content


Recommended content

Editors’ Picks

EUR/USD edges lower toward 1.0700 post-US PCE

EUR/USD edges lower toward 1.0700 post-US PCE

EUR/USD stays under modest bearish pressure but manages to hold above 1.0700 in the American session on Friday. The US Dollar (USD) gathers strength against its rivals after the stronger-than-forecast PCE inflation data, not allowing the pair to gain traction.

EUR/USD News

GBP/USD retreats to 1.2500 on renewed USD strength

GBP/USD retreats to 1.2500 on renewed USD strength

GBP/USD lost its traction and turned negative on the day near 1.2500. Following the stronger-than-expected PCE inflation readings from the US, the USD stays resilient and makes it difficult for the pair to gather recovery momentum.

GBP/USD News

Gold struggles to hold above $2,350 following US inflation

Gold struggles to hold above $2,350 following US inflation

Gold turned south and declined toward $2,340, erasing a large portion of its daily gains, as the USD benefited from PCE inflation data. The benchmark 10-year US yield, however, stays in negative territory and helps XAU/USD limit its losses. 

Gold News

Bitcoin Weekly Forecast: BTC’s next breakout could propel it to $80,000 Premium

Bitcoin Weekly Forecast: BTC’s next breakout could propel it to $80,000

Bitcoin’s recent price consolidation could be nearing its end as technical indicators and on-chain metrics suggest a potential upward breakout. However, this move would not be straightforward and could punish impatient investors. 

Read more

Week ahead – Hawkish risk as Fed and NFP on tap, Eurozone data eyed too

Week ahead – Hawkish risk as Fed and NFP on tap, Eurozone data eyed too

Fed meets on Wednesday as US inflation stays elevated. Will Friday’s jobs report bring relief or more angst for the markets? Eurozone flash GDP and CPI numbers in focus for the Euro.

Read more

Forex MAJORS

Cryptocurrencies

Signatures