- EUR/GBP bounces off two-week low amid oversold RSI conditions.
- Upside remains capped below 61.8% Fibonacci retracement.
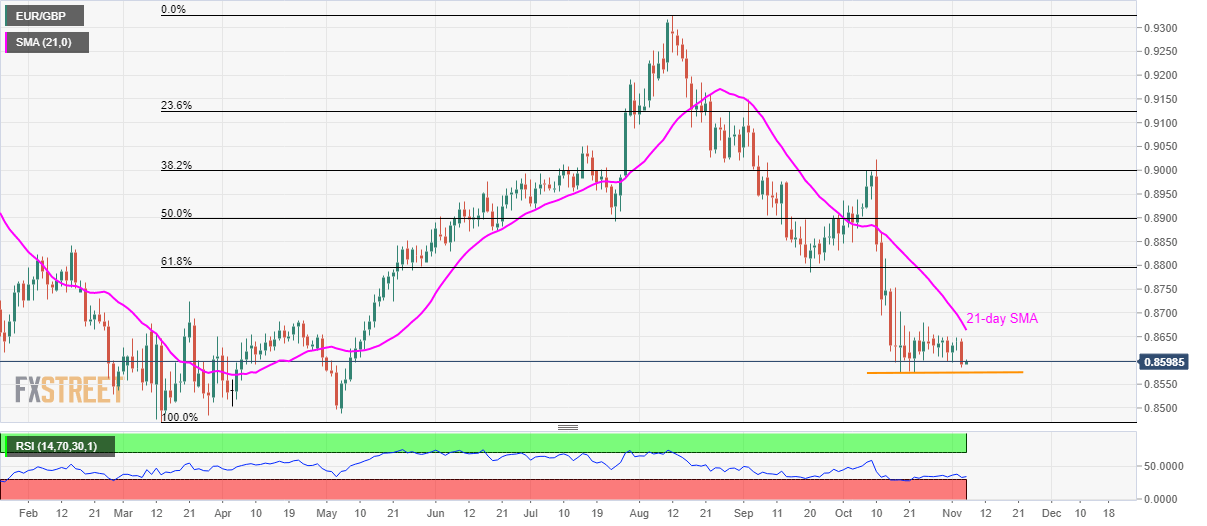
Despite taking a U-turn from the multi-day bottom, EUR/GBP follows the short-term range while heading into the European session on Wednesday. The quote takes the rounds to 0.8595 by the press time.
While oversold conditions of 14-bar Relative Strength Index (RSI) favor further recovery, 21-day Simple Moving Average (SMA) level of 0.8664 keeps the rise in check, if not then 0.8700 and 0.8750/55 will question buyers.
It should, however, be noted that bulls can’t be convinced unless prices flash a daily closing beyond 61.8% Fibonacci retracement of March-August upside, at 0.8800.
On the downside, multiple supports around 0.8575 restrict the pair’s immediate declines, ahead of driving it lower to 0.8500 mark.
If at all bears keep the reins past-0.8500, May month low near 0.8490 and March bottom close to 0.8470 could gain market attention.
EUR/GBP daily chart
Trend: sideways
Information on these pages contains forward-looking statements that involve risks and uncertainties. Markets and instruments profiled on this page are for informational purposes only and should not in any way come across as a recommendation to buy or sell in these assets. You should do your own thorough research before making any investment decisions. FXStreet does not in any way guarantee that this information is free from mistakes, errors, or material misstatements. It also does not guarantee that this information is of a timely nature. Investing in Open Markets involves a great deal of risk, including the loss of all or a portion of your investment, as well as emotional distress. All risks, losses and costs associated with investing, including total loss of principal, are your responsibility. The views and opinions expressed in this article are those of the authors and do not necessarily reflect the official policy or position of FXStreet nor its advertisers. The author will not be held responsible for information that is found at the end of links posted on this page.
If not otherwise explicitly mentioned in the body of the article, at the time of writing, the author has no position in any stock mentioned in this article and no business relationship with any company mentioned. The author has not received compensation for writing this article, other than from FXStreet.
FXStreet and the author do not provide personalized recommendations. The author makes no representations as to the accuracy, completeness, or suitability of this information. FXStreet and the author will not be liable for any errors, omissions or any losses, injuries or damages arising from this information and its display or use. Errors and omissions excepted.
The author and FXStreet are not registered investment advisors and nothing in this article is intended to be investment advice.
Recommended content
Editors’ Picks
EUR/USD trades with negative bias, holds above 1.0700 as traders await US PCE Price Index

EUR/USD edges lower during the Asian session on Friday and moves away from a two-week high, around the 1.0740 area touched the previous day. Spot prices trade around the 1.0725-1.0720 region and remain at the mercy of the US Dollar price dynamics ahead of the crucial US data.
USD/JPY jumps above 156.00 on BoJ's steady policy

USD/JPY has come under intense buying pressure, surging past 156.00 after the Bank of Japan kept the key rate unchanged but tweaked its policy statement. The BoJ maintained its fiscal year 2024 and 2025 core inflation forecasts, disappointing the Japanese Yen buyers.
Gold price flatlines as traders look to US PCE Price Index for some meaningful impetus

Gold price lacks any firm intraday direction and is influenced by a combination of diverging forces. The weaker US GDP print and a rise in US inflation benefit the metal amid subdued USD demand. Hawkish Fed expectations cap the upside as traders await the release of the US PCE Price Index.
Sei Price Prediction: SEI is in the zone of interest after a 10% leap

Sei price has been in recovery mode for almost ten days now, following a fall of almost 65% beginning in mid-March. While the SEI bulls continue to show strength, the uptrend could prove premature as massive bearish sentiment hovers above the altcoin’s price.
US economy: Slower growth with stronger inflation

The US Dollar strengthened, and stocks fell after statistical data from the US. The focus was on the preliminary estimate of GDP for the first quarter. Annualised quarterly growth came in at just 1.6%, down from the 2.5% and 3.4% previously forecast.