|

EUR/GBP Price Forecast: Potentially unfolding up leg within range

  • EUR/GBP might be unfolding a bullish leg within a sideways range.  
  • The MACD has crossed its signal line and is above zero, – a bullish sign. 

EUR/GBP is clawing its way back up within its multi-week range. It is possible that this may be the start of an up leg within the range towards the ceiling at around 0.8450.

The pair is probably in a sideways trend on a short-term basis and given the principle of technical analysis that prices are more likely to extend in the direction in which they are trending it will probably continue oscillating in its sideways trend until it makes a decisive breakout either higher or lower. It is overall at two and a half year lows. 

EUR/GBP 4-hour Chart 

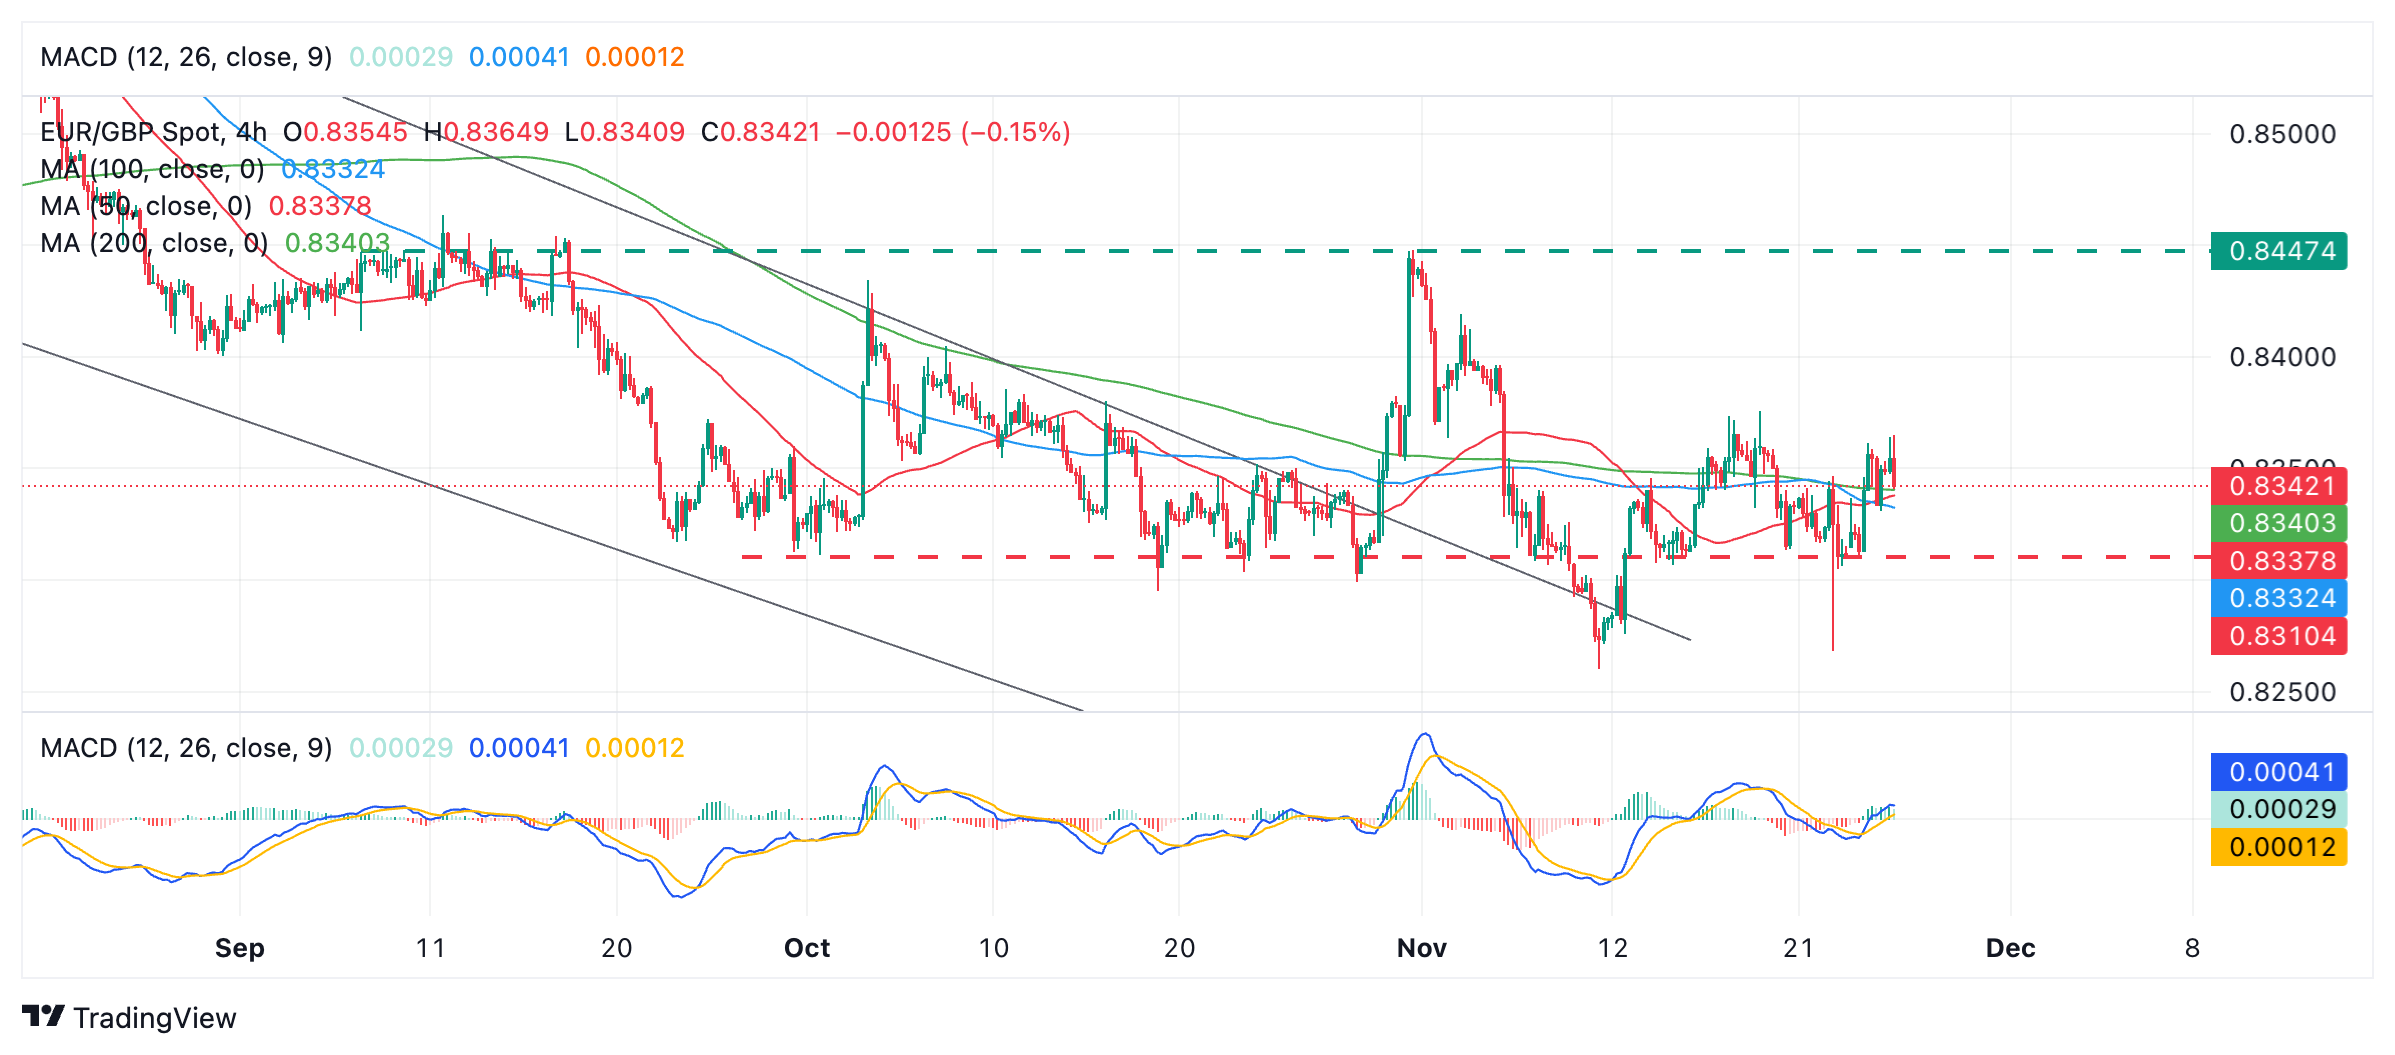
EUR/GBP made a false break lower on November 8 and then, a second time, on an intraday basis, on November 22. On both occasions it failed to follow-through lower, however, and instead just recovered back inside the range. 

Because it is in a sideways trend the odds favor a continuation sideways, which suggests the possibility of a recovery from the current level up to ceiling. 

A break above 0.8375 would probably lead to a continuation higher to a target at 0.8440, just below the ceiling. 

The Moving Average Convergence Divergence (MACD) momentum indicator, which is a reliablñe indicator in sideways markets has crossed above its red signal line and is also now above the zero line suggesting a bullish short-term bias.

Author

Joaquin Monfort

Joaquin Monfort is a financial writer and analyst with over 10 years experience writing about financial markets and alt data. He holds a degree in Anthropology from London University and a Diploma in Technical analysis.

More from Joaquin Monfort
Share:

Editor's Picks

AUD/USD eyes 0.7150 barrier nine-day EMA

AUD/USD inches higher after registering modest losses in the previous day, trading around 0.7130 during the Asian hours. The technical analysis of the daily chart indicates that the pair is moving sideways within the rectangle pattern, suggesting a consolidation as neither the bulls nor the bears have enough momentum to take control of the market.

USD/JPY trades below 160.00 intervention threshold; bullish bias intact

The USD/JPY pair attracts some sellers during the Asian session amid fears that authorities will step in again to prop up the Japanese Yen. Furthermore, the Israel-Lebanon truce prompts some profit-taking around the US Dollar and exerts downward pressure on the currency pair.

Gold meets contention near $4,420…for now

Gold extends its recovery past the $4,500 mark per troy ounce on Thursday. The yellow metal’s advance comes amid the resurgence of some selling interest around the, improving risk sentiment, and declining US Treasury yields across the curve.

Bitcoin’s massive storm is back: Why the sell-off is far from over

Bitcoin price action over the last few weeks has felt less like a normal, healthy correction and more like a slow grinding crash that continues to wreak havoc on holdings and trading accounts. And everything suggests that the dramatic crash isn’t over.

Nonfarm payrolls: Testing the limits of Fed policy patience

The upcoming nonfarm payrolls report for May will provide the final update on the US labor market before Kevin Warsh attends his first policy meeting as the new Fed Chair later this month.

Recession on paper: What really moves the Canadian Loonie now?

Statistics Canada handed the headline writers a gift and the analysts a headache. Real GDP shrank 0.1% on an annualized basis in the first quarter, and with the fourth quarter of 2025 revised down to a 1.0% contraction, that is two negative quarters in a row, the textbook definition of a technical recession and Canada's first since the pandemic.