|

EUR/GBP Price Forecast: Bounces off multi-year lows, risk of trend reversal

  • EUR/GBP bounces off key lows and rallies strongly. 
  • Too soon to say whether the pair is reversing trend or correcting, however, upside is strong so far. 

EUR/GBP has bounced off key support (gray dashed line) at multi-year lows and risen over a percentage point to trade above 0.8400 on Thursday. 

EUR/GBP 4-hour Chart 

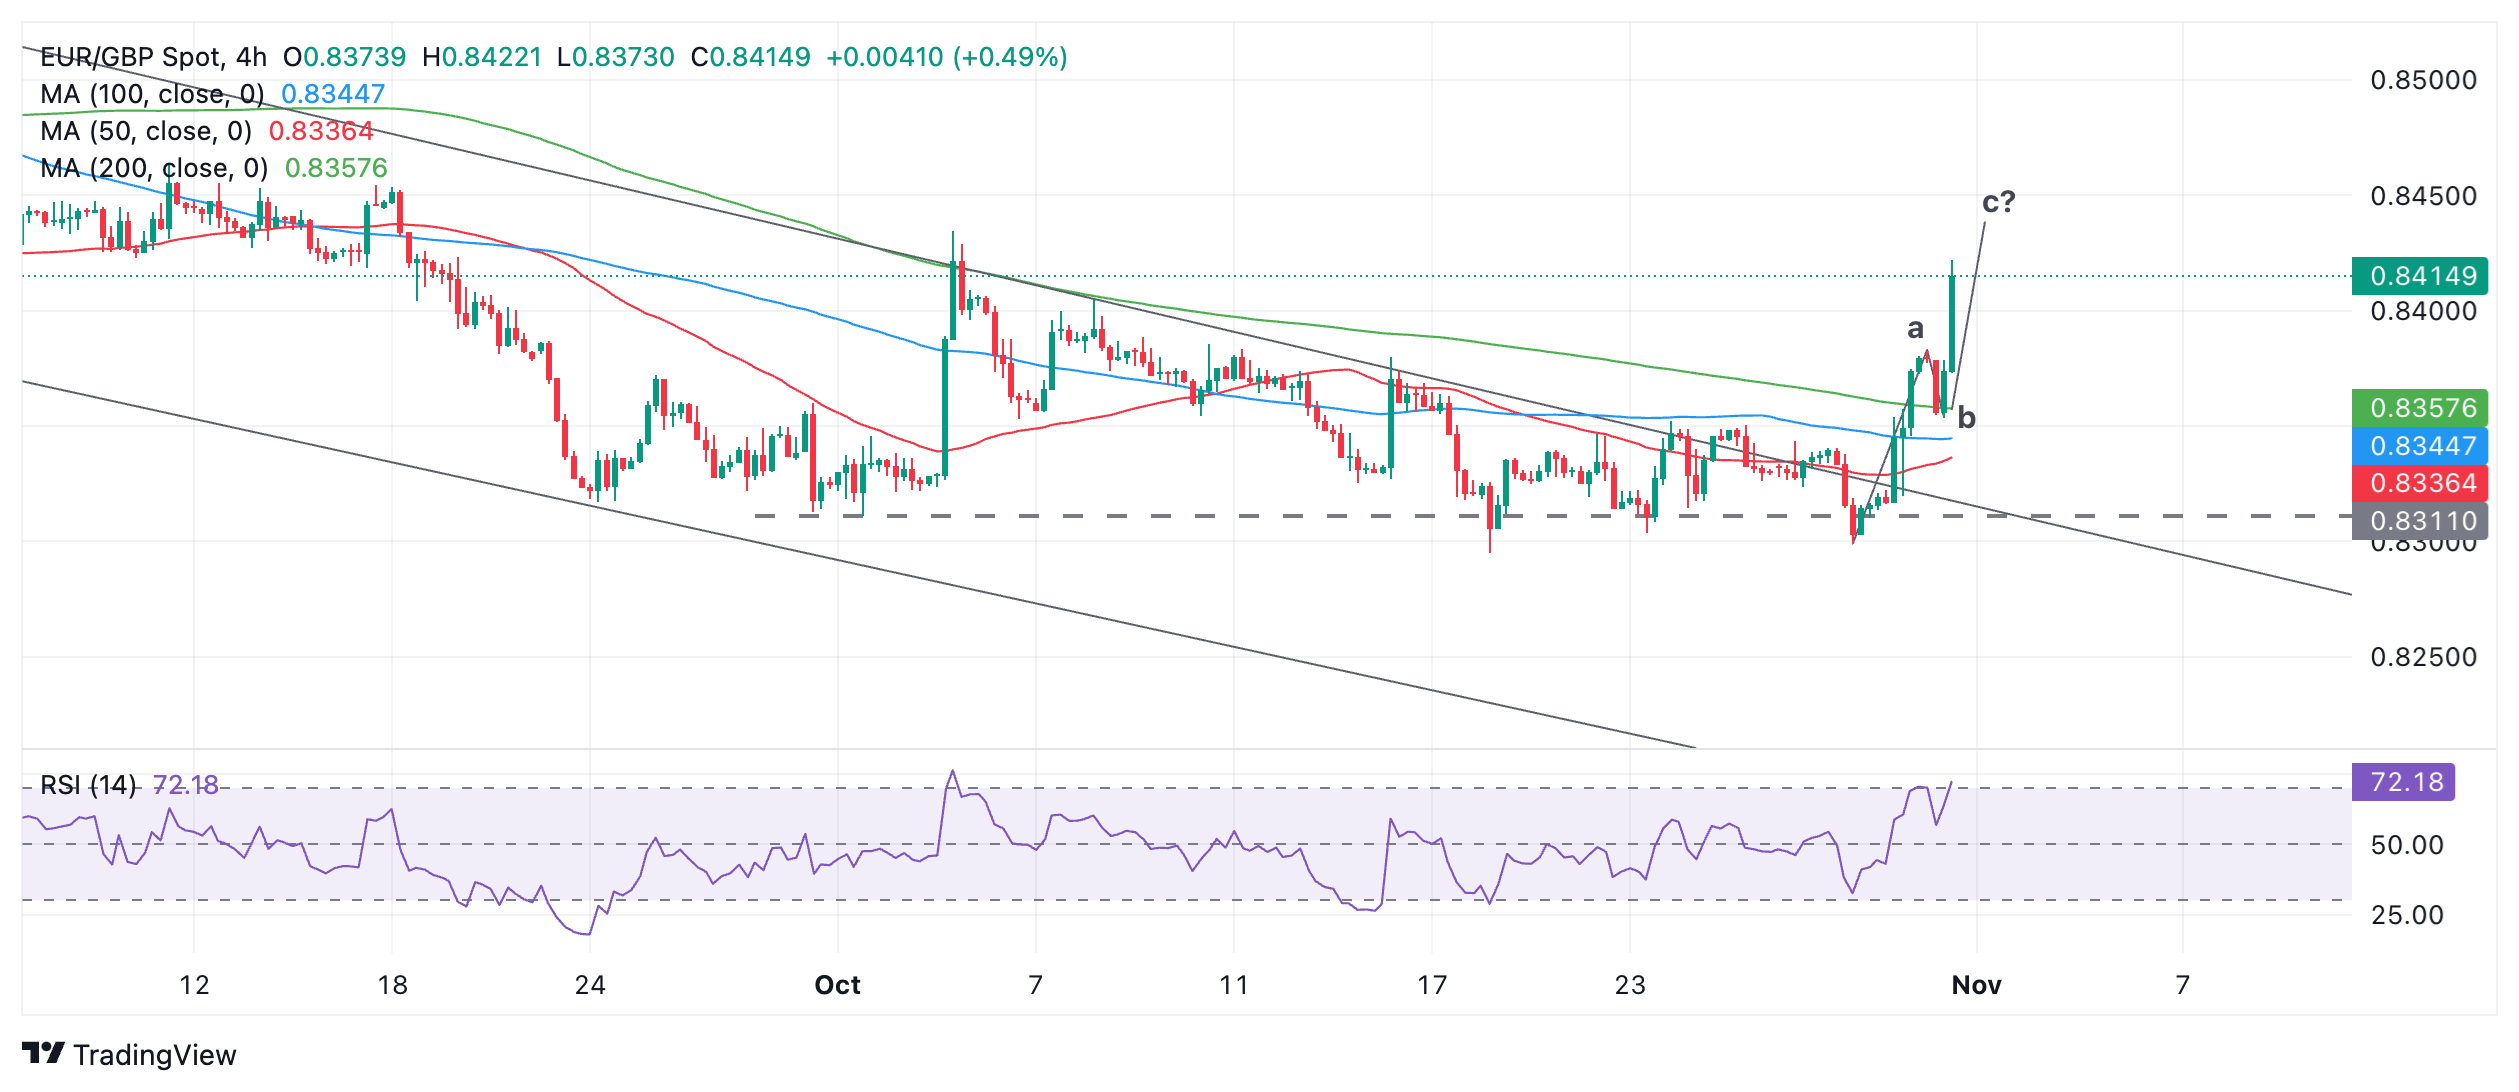
The pair has risen very steeply over the last two days and this could be a sign the short-term trend is reversing and turning higher. If so the bias will be to the upside given the technical analysis principle that “the trend is your friend”. It is too early to be sure this is the case however. 

It is also possible to characterize EUR/GBP as merely correcting back and forming a common three-wave abc correction in the process. This would imply price will roll over after wave c ic completed and possibly even fall back down to the 0.8300 lows. 

The speed and strength of the rally over the last 48 hours, however, suggests EUR/GBP may not just be forming an abc correction, but that it could be completely reversing trend and turning bullish. Ultimately, evidence is required to be confident of such a reversal.

The Relative Strength Index (RSI) momentum indicator entered the overbought zone (above 70) this period, however, we will not know whether it remains there until the current candle closes. At the moment that looks likely. 

If RSI closes above 70 then it will be a sign for long-holders not to add to their positions, since there is a material risk of the price pulling back.

Author

Joaquin Monfort

Joaquin Monfort is a financial writer and analyst with over 10 years experience writing about financial markets and alt data. He holds a degree in Anthropology from London University and a Diploma in Technical analysis.

More from Joaquin Monfort
Share:

Editor's Picks

AUD/USD eyes 0.7150 barrier nine-day EMA

AUD/USD inches higher after registering modest losses in the previous day, trading around 0.7130 during the Asian hours. The technical analysis of the daily chart indicates that the pair is moving sideways within the rectangle pattern, suggesting a consolidation as neither the bulls nor the bears have enough momentum to take control of the market.

USD/JPY trades below 160.00 intervention threshold; bullish bias intact

The USD/JPY pair attracts some sellers during the Asian session amid fears that authorities will step in again to prop up the Japanese Yen. Furthermore, the Israel-Lebanon truce prompts some profit-taking around the US Dollar and exerts downward pressure on the currency pair.

Gold meets contention near $4,420…for now

Gold extends its recovery past the $4,500 mark per troy ounce on Thursday. The yellow metal’s advance comes amid the resurgence of some selling interest around the, improving risk sentiment, and declining US Treasury yields across the curve.

Bitcoin’s massive storm is back: Why the sell-off is far from over

Bitcoin price action over the last few weeks has felt less like a normal, healthy correction and more like a slow grinding crash that continues to wreak havoc on holdings and trading accounts. And everything suggests that the dramatic crash isn’t over.

Nonfarm payrolls: Testing the limits of Fed policy patience

The upcoming nonfarm payrolls report for May will provide the final update on the US labor market before Kevin Warsh attends his first policy meeting as the new Fed Chair later this month.

Recession on paper: What really moves the Canadian Loonie now?

Statistics Canada handed the headline writers a gift and the analysts a headache. Real GDP shrank 0.1% on an annualized basis in the first quarter, and with the fourth quarter of 2025 revised down to a 1.0% contraction, that is two negative quarters in a row, the textbook definition of a technical recession and Canada's first since the pandemic.