|

EUR/GBP Price Analysis: Reaches downside target for range breakout

  • EUR/GBP has hit the key downside target for its range breakout. 
  • The Relative Strength Index has fallen into the oversold zone. 
  • The technical picture suggests the pair is in a bearish trend but risks pulling back in the short-term.
     

EUR/GBP is in a downtrend with odds favoring a continuation lower whilst a heightened chance in the short-term the pair might pull back first. 

EUR/GBP has broken out of a range and fallen to a key downside target based on the breakout. The achievement of the target suggests a risk that the pair may bottom out and rotate higher in a pullback. 

EUR/GBP Daily Chart 

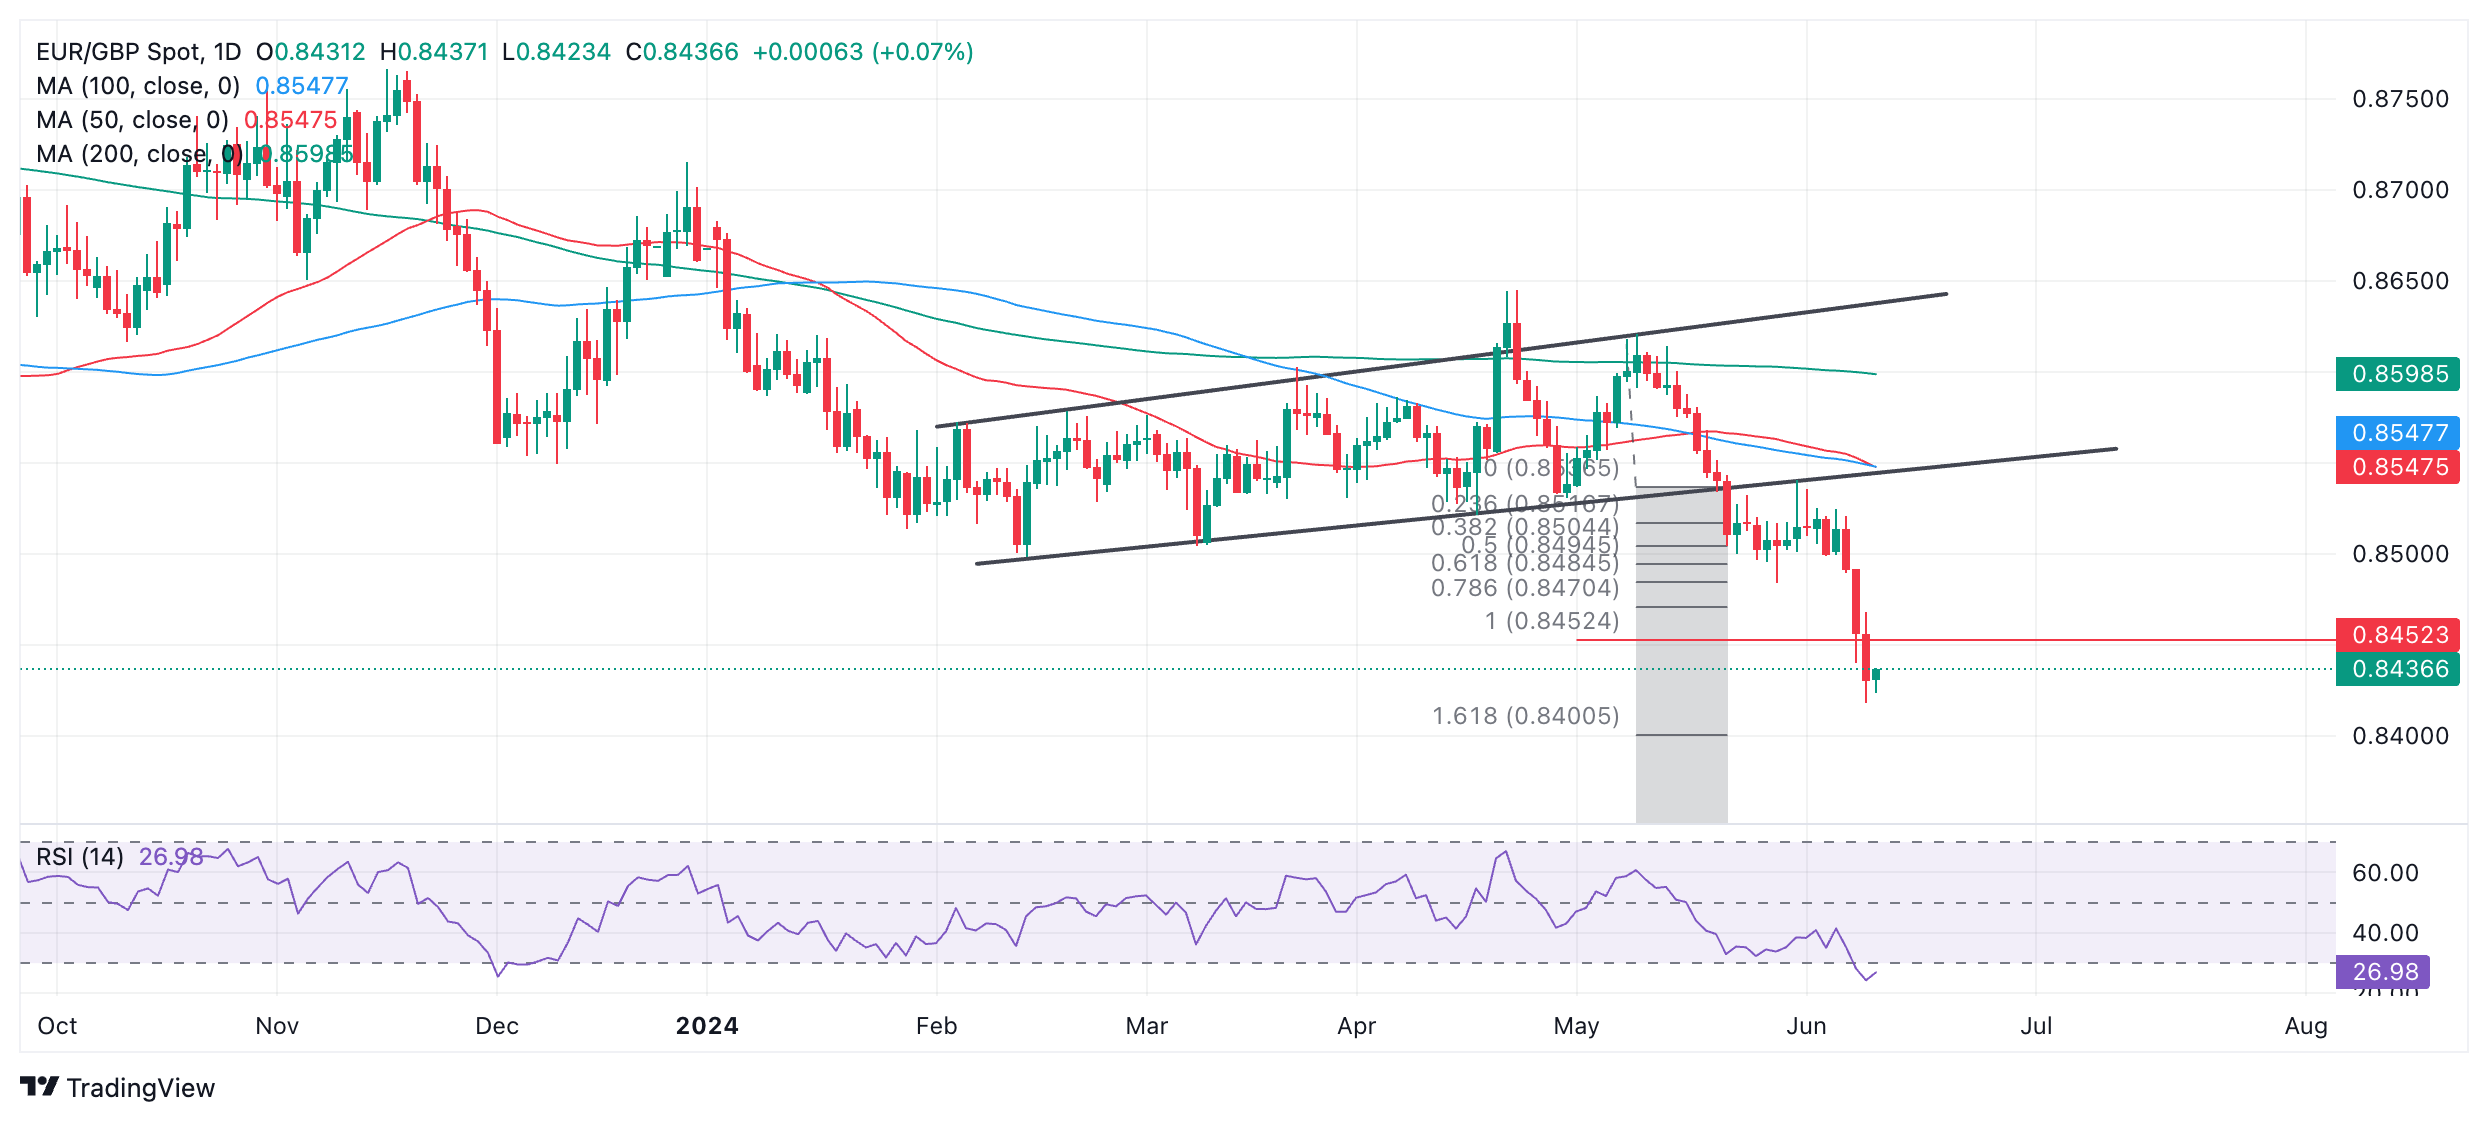
The trend, both on a short, intermediate and long-term basis is bearish on balance, however, suggesting a continued risk of more downside once the pullback, if it evolves, completes. 

Price has reached both the conservative and main target for the breakout from the range that evolved during 2024. The main target lies at 0.8452, the 100% extrapolation of the height of the range lower. 

The Relative Strength Index (RSI) is oversold, suggesting the downtrend may be overstretched and that short-holders should not add to their positions. It also increases the probability of correction higher unfolding. 

Given the dominant downtrend, the pair will probably resume its decline once any corrections complete. A break below 0.8418 (June 11 low) would create a lower low and probably result in a deeper sell-off, with 0.8400 coming in as the next target, followed by 0.8340 (August 2022 low). 

Author

Joaquin Monfort

Joaquin Monfort is a financial writer and analyst with over 10 years experience writing about financial markets and alt data. He holds a degree in Anthropology from London University and a Diploma in Technical analysis.

More from Joaquin Monfort
Share:

Editor's Picks

AUD/USD eyes 0.7150 barrier nine-day EMA

AUD/USD inches higher after registering modest losses in the previous day, trading around 0.7130 during the Asian hours. The technical analysis of the daily chart indicates that the pair is moving sideways within the rectangle pattern, suggesting a consolidation as neither the bulls nor the bears have enough momentum to take control of the market.

USD/JPY trades below 160.00 intervention threshold; bullish bias intact

The USD/JPY pair attracts some sellers during the Asian session amid fears that authorities will step in again to prop up the Japanese Yen. Furthermore, the Israel-Lebanon truce prompts some profit-taking around the US Dollar and exerts downward pressure on the currency pair.

Gold defends 200-day SMA, rises toward $4,500

Gold is attempting a tepid recovery toward $4,500 on Thursday, as renewed optimism in the Mideast geopolitical front calms market nerves. This cautious optimism across Asian markets weighs on Oil prices, and diminishes the US Dollar’s safe-haven appeal, helping Gold stage a decent comeback from the weekly low of $4,424.


Hyperliquid: ETF demand, capital rotation fuel HYPE rally as Bitcoin melts

Hyperliquid price sustains an upward trend near its all-time high of $75.76 on Thursday after posting 80% gains in May, while Bitcoin (BTC) retraces below $65,000, triggering a market-wide panic.

Kevin Warsh takes the Fed helm: What it means for the US Dollar
The Federal Reserve moves away from the highly predictable "forward guidance" model of the Jerome Powell era to a new “Kevin Warsh environment”, characterized by less communication, more policy surprises, and an increased focus on the Fed's complex balance sheet.
Recession on paper: What really moves the Canadian Loonie now?

Statistics Canada handed the headline writers a gift and the analysts a headache. Real GDP shrank 0.1% on an annualized basis in the first quarter, and with the fourth quarter of 2025 revised down to a 1.0% contraction, that is two negative quarters in a row, the textbook definition of a technical recession and Canada's first since the pandemic.