EUR/GBP Price Analysis: Looks set to re-test 13-month-old horizontal support
- EUR/GBP eases from intraday top, stays below two-month-old resistance line, 10-day SMA.
- Oversold RSI tests bears around the key support line but strong hurdles to the north stop buyers’ entries.
EUR/GBP steps back from intraday high to 0.8568 ahead of Wednesday’s European session. In doing so, the quote struggles for a clear direction below the key resistances amid oversold RSI.
Although multiple recovery-points around the mid-0.8500s test the pair’s immediate downside, bulls may not be able to cheer extreme RSI conditions unless breaking a downward sloping trend line from late-January, currently around 0.8635.
However, a corrective pullback towards a 10-day SMA level of 0.8580 can’t be ruled out.
Meanwhile, EUR/GBP traders’ refrain to respect the RSI signals will direct bears to battle a horizontal line around 0.8540 comprising February 2020 high and the previous month’s low.
It’s worth mentioning that the EUR/GBP rally past-0.8635 won’t hesitate to refresh the monthly top around 0.8735-40 whereas a downside break of 0.8540 should quickly break the 0.8500 threshold.
Overall, EUR/GBP bears seem tiring near the key support but the bulls need strong signals to return.
EUR/GBP daily chart
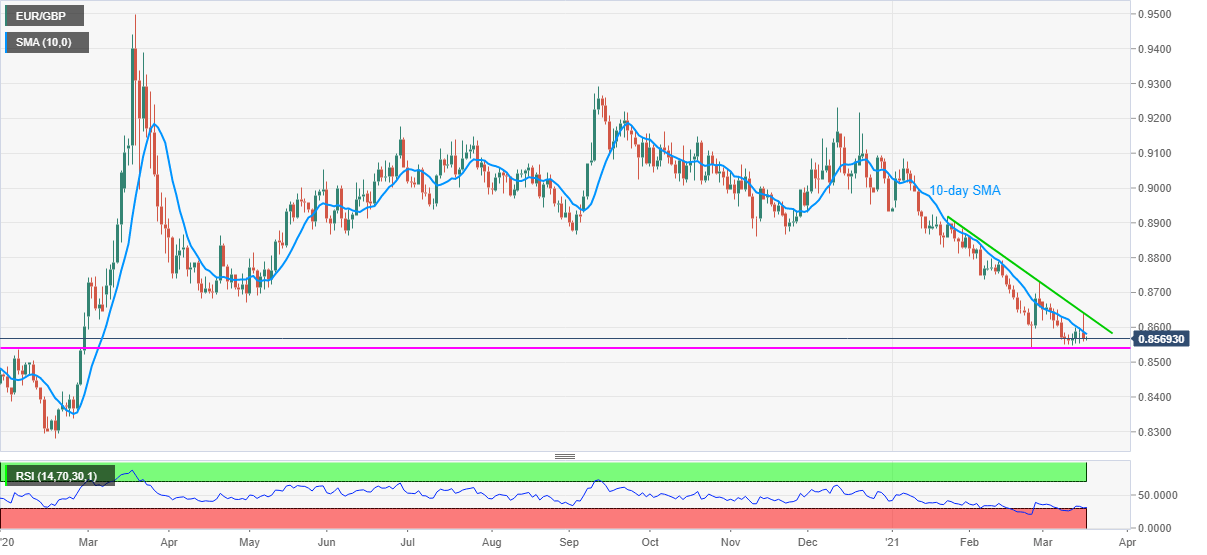
Trend: Sideways
Author

Anil Panchal
FXStreet
Anil Panchal has nearly 15 years of experience in tracking financial markets. With a keen interest in macroeconomics, Anil aptly tracks global news/updates and stays well-informed about the global financial moves and their implications.


