EUR/GBP Price Analysis: Corrective bounce remains elusive below 0.8640


  • EUR/GBP extends previous week’s rebound from yearly low amid oversold RSI.
  • Support-turned-resistance line, bearish MACD signals challenge pair buyers.
  • 11-month-old horizontal support area appears a tough nut to crack for bears.

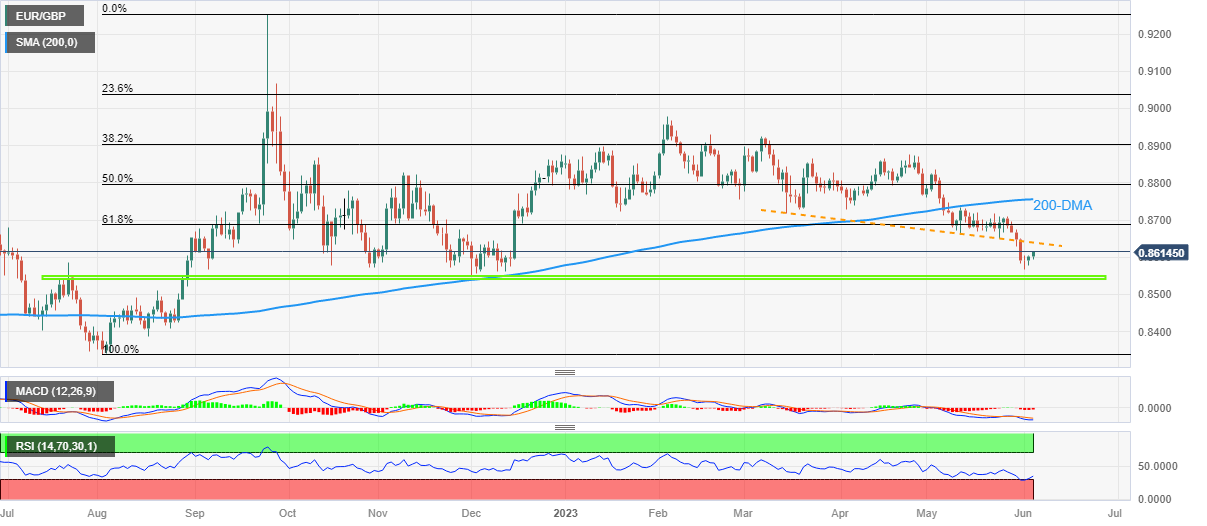
EUR/GBP picks up bids to stretch the previous week’s recovery from the lowest levels in 2023 heading into Monday’s European session. In doing so, the cross-currency pair justifies the oversold RSI (14) line to print the two-day rebound.

However, the previous support line from March 15, around 0.8640 by the press time, as well as the bearish MACD signals, challenge the EUR/GBP pair buyers.

Even if the quote crosses the 0.8640 hurdle, the 61.8% Fibonacci retracement of its August-September 2022 upside, near 0.8690, quickly followed by the 0.8700 round figure, can challenge the EUR/GBP bulls.

It’s worth noting that the 200-DMA level surrounding 0.8755 acts as the last defense of the EUR/GBP bears, a break of which could convince pair buyers to aim for the previous monthly high of 0.8834.

On the flip side, EUR/GBP sellers need validation from the 0.8600 round to return to the table.

Even so, a horizontal area comprising multiple levels marked since July 2022, close to 0.8550-40 by the press time, appears a tough nut to crack for the pair bears before approaching the late 2022 trough of around 0.8340.

Overall, EUR/GBP is likely to pare the latest monthly loss but the room towards the north appears limited.

EUR/GBP: Daily chart

Trend: Limited recovery expected

Additional important levels

Overview
Today last price 0.8612
Today Daily Change 0.0011
Today Daily Change % 0.13%
Today daily open 0.8601
 
Trends
Daily SMA20 0.8676
Daily SMA50 0.8751
Daily SMA100 0.8792
Daily SMA200 0.8755
 
Levels
Previous Daily High 0.8605
Previous Daily Low 0.8578
Previous Weekly High 0.8695
Previous Weekly Low 0.8568
Previous Monthly High 0.8835
Previous Monthly Low 0.8583
Daily Fibonacci 38.2% 0.8595
Daily Fibonacci 61.8% 0.8589
Daily Pivot Point S1 0.8585
Daily Pivot Point S2 0.8568
Daily Pivot Point S3 0.8558
Daily Pivot Point R1 0.8611
Daily Pivot Point R2 0.8622
Daily Pivot Point R3 0.8638


Share: Feed news

Information on these pages contains forward-looking statements that involve risks and uncertainties. Markets and instruments profiled on this page are for informational purposes only and should not in any way come across as a recommendation to buy or sell in these assets. You should do your own thorough research before making any investment decisions. FXStreet does not in any way guarantee that this information is free from mistakes, errors, or material misstatements. It also does not guarantee that this information is of a timely nature. Investing in Open Markets involves a great deal of risk, including the loss of all or a portion of your investment, as well as emotional distress. All risks, losses and costs associated with investing, including total loss of principal, are your responsibility. The views and opinions expressed in this article are those of the authors and do not necessarily reflect the official policy or position of FXStreet nor its advertisers. The author will not be held responsible for information that is found at the end of links posted on this page.

If not otherwise explicitly mentioned in the body of the article, at the time of writing, the author has no position in any stock mentioned in this article and no business relationship with any company mentioned. The author has not received compensation for writing this article, other than from FXStreet.

FXStreet and the author do not provide personalized recommendations. The author makes no representations as to the accuracy, completeness, or suitability of this information. FXStreet and the author will not be liable for any errors, omissions or any losses, injuries or damages arising from this information and its display or use. Errors and omissions excepted.

The author and FXStreet are not registered investment advisors and nothing in this article is intended to be investment advice.

Recommended content


Recommended content

Editors’ Picks

USD/JPY jumps above 156.00 on BoJ's steady policy

USD/JPY jumps above 156.00 on BoJ's steady policy

USD/JPY has come under intense buying pressure, surging past 156.00 after the Bank of Japan kept the key rate unchanged but tweaked its policy statement. The BoJ maintained its fiscal year 2024 and 2025 core inflation forecasts, disappointing the Japanese Yen buyers. 

USD/JPY News

AUD/USD consolidates gains above 0.6500 after Australian PPI data

AUD/USD consolidates gains above 0.6500 after Australian PPI data

AUD/USD is consolidating gains above 0.6500 in Asian trading on Friday. The pair capitalizes on an annual increase in Australian PPI data. Meanwhile, a softer US Dollar and improving market mood also underpin the Aussie ahead of the US PCE inflation data. 

AUD/USD News

Gold price keeps its range around $2,330, awaits US PCE data

Gold price keeps its range around $2,330, awaits US PCE data

Gold price is consolidating Thursday's rebound early Friday. Gold price jumped after US GDP figures for the first quarter of 2024 missed estimates, increasing speculation that the Fed could lower borrowing costs. Focus shifts to US PCE inflation on Friday. 

Gold News

Stripe looks to bring back crypto payments as stablecoin market cap hits all-time high

Stripe looks to bring back crypto payments as stablecoin market cap hits all-time high

Stripe announced on Thursday that it would add support for USDC stablecoin, as the stablecoin market exploded in March, according to reports by Cryptocompare.

Read more

US economy: Slower growth with stronger inflation

US economy: Slower growth with stronger inflation

The US Dollar strengthened, and stocks fell after statistical data from the US. The focus was on the preliminary estimate of GDP for the first quarter. Annualised quarterly growth came in at just 1.6%, down from the 2.5% and 3.4% previously forecast.

Read more

Forex MAJORS

Cryptocurrencies

Signatures