|

EUR/GBP falls to nine-month lows below 0.8550

  • EUR/GBP falls to a 9-month low as ECB approaches its peak rate and the BoE is ready to continue tightening.
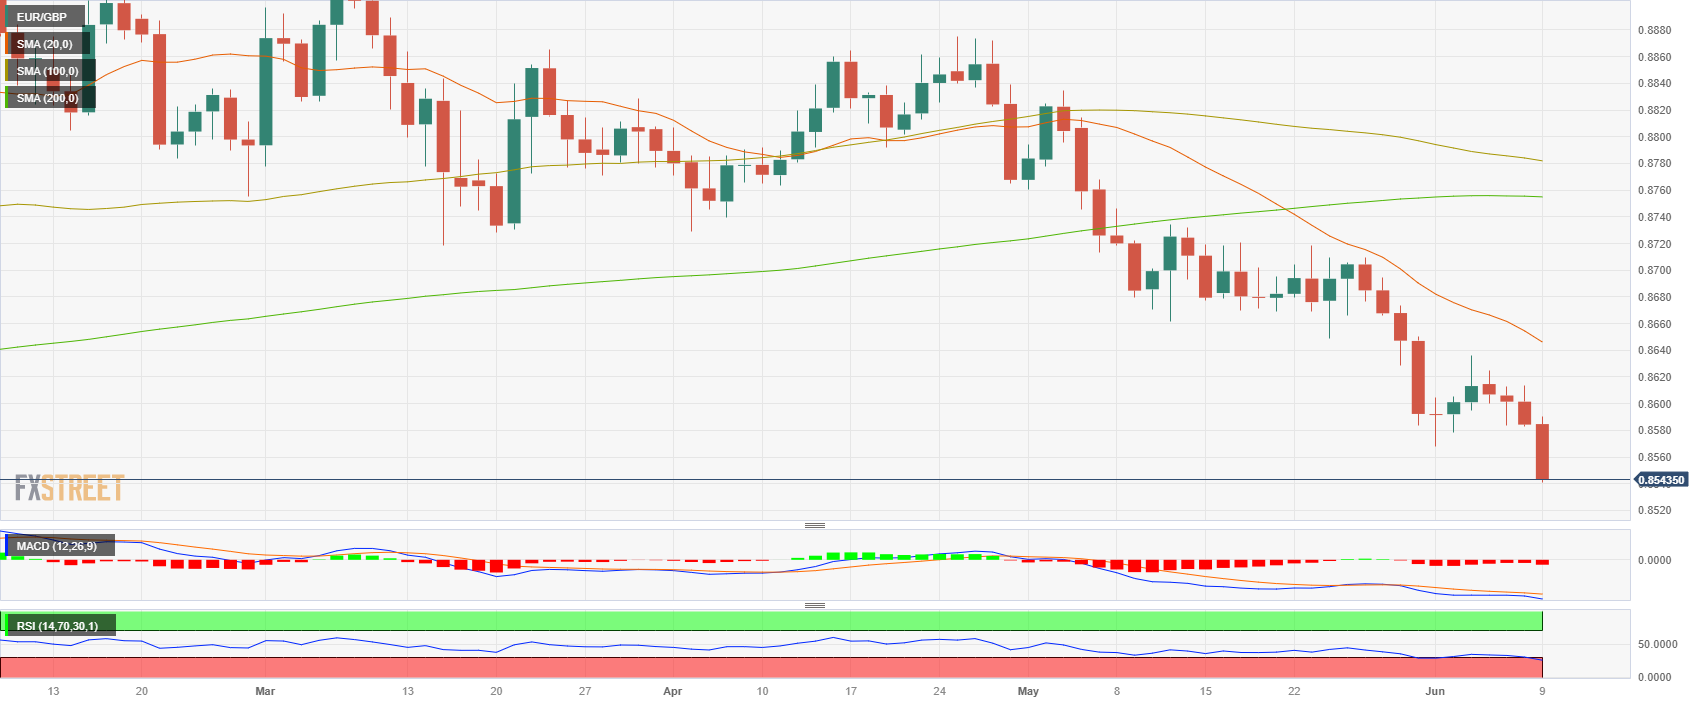
  • The pair signals oversold conditions on the daily chart for the first time since 2021.
  • Weak economic data from Italy and Germany contribute to Euro's decline..

The EUR/GBP pair has recently witnessed a substantial decline, falling to a nine-month low at 0.8540 and stabilizing around 0.8545. This prolonged downward trend reflects the difficulties faced by the Euro amid the economic downturn in the Eurozone. However, there is some optimism for the British economy as the Bank of England's projections indicate that the United Kingdom is likely to steer clear of a recession. Furthermore, the fact that inflation in the UK is running high is fueling hawkish bets on the Bank of England (BoE), giving additional support to the Sterling.

German yields decline on weak economic data

The National Institute of Statistics from Italy released that Italian Industrial output decreased by 1.9% in April vs the 0.1% expansion expected from its previous figure which also showed a contraction of -0.6%. On a yearly basis, the output is now down 7.2%. Adding to that, the EZ reported weak final revisions of Q1 Gross Domestic Product (GDP) on Thursday while Germany (the most important economic block from the EZ) goes through a technical recession.

The German yields weakened across the curve on Friday. The 10-year bond yield fell to 2.37% while the 2-year yield sits at 2.96% and the 5-year at 2.42%. In addition, the German DAX  stock index closed this week with 0.60 % losses indicating a negative sentiment towards de economic activity in Germany and hence applying selling pressure on the Euro.

For the upcoming European Central Bank (ECB) decision next week, markets are foreseeing a 25 basis point (bps) rate hike announcement and another one in either July or September. For the BoE market participants are anticipating a 100 bps hike to 5.50% for the remained of the tightening cycle.

EUR/GBP levels to watch

According to the daily chart, the EUR/GBP holds a bearish outlook for the short term as the Relative Strength Index (RSI) and Moving Average Convergence Divergence (MACD) both suggest that the sellers have control while the pair trades below its main moving averages.

In case the pair faces further downside, support levels line up at the multi-year low at 0.8540 and below around the 0.8535 zone and the 0.8520 level. Conversely, in case the EUR/GBP regains traction, the following resistance lineup at the 0.8560 zone followed by 0.8580 (June 7 low) and the 0.8600 psychological mark.

EUR/GBP daily chart 
EUR/GBP

Overview
Today last price0.8543
Today Daily Change-0.0041
Today Daily Change %-0.48
Today daily open0.8584
 
Trends
Daily SMA200.8655
Daily SMA500.8735
Daily SMA1000.8784
Daily SMA2000.8755
 
Levels
Previous Daily High0.8614
Previous Daily Low0.8583
Previous Weekly High0.8695
Previous Weekly Low0.8568
Previous Monthly High0.8835
Previous Monthly Low0.8583
Daily Fibonacci 38.2%0.8595
Daily Fibonacci 61.8%0.8602
Daily Pivot Point S10.8574
Daily Pivot Point S20.8563
Daily Pivot Point S30.8543
Daily Pivot Point R10.8604
Daily Pivot Point R20.8625
Daily Pivot Point R30.8635

Author

Patricio Martín

Patricio is an economist from Argentina passionate about global finance and understanding the daily movements of the markets.


More from Patricio Martín
Share:

Editor's Picks

AUD/USD flirts with 0.7000, lowest since early August amid bullish USD

AUD/USD hits a fresh low since early August during the Asian session on Friday and looks vulnerable near 0.7000 after breaking below the 200-day SMA overnight. Against the backdrop of the hawkish Fed, a two-day rally in oil prices revives inflation fears and continues to push US bond yields to multi-year highs. Adding to this, geopolitical risks lift the US Dollar to a two-month high, overshadowing RBA rate hike bets and weighing on the pair.

USD/JPY pulls back from three-week high after failing near 159.00

USD/JPY edges lower during the Asian session on Friday, stalling its recent strong move to a three-week high of 159.00 as Japanese Yen bears turn cautious amid intervention fears. Meanwhile, the US Dollar retains a strong bullish undertone as the Fed's hawkish outlook and oil-driven inflation fears continue to push US bond yields to multi-year peaks. Furthermore, the BoJ's dovish rate hike last week might cap JPY and support spot prices.

Gold treads water below $4,300

Gold grabs some buying attention and advances marginally at the end of the week, partially retracing the weekly decline, although it is still navigating below the key $4,300 mark per troy ounce. The fresh selling bias on the Greenback and the modest decline in US Treasury yields appear to support the humble advance in the precious metal.

Crypto Today: Bitcoin and Ethereum edge lower, XRP extends recovery as macro headwinds weigh

The broader cryptocurrency market is consolidating on Friday, with Bitcoin paring losses slightly above $84,000. Ethereum declines in tandem with BTC. Ripple (XRP), meanwhile, paints a different picture.


Fed vs BoJ: Both hiked. The market only believes one of them – and the chart shows which
The Federal Reserve (Fed) and the Bank of Japan (BoJ) have just done something remarkably similar. Both central banks raised interest rates by 25 basis points (bps) last week, both are confronting inflation risks, and both signal that future decisions will depend on incoming economic data.
Fed vs BoJ: Both hiked. The market only believes one of them – and the chart shows which

The Fed and the BoJ have just done something remarkably similar. Both central banks raised interest rates by 25 bps last week, both are confronting inflation risks, and both signal that future decisions will depend on incoming economic data.













