|

EUR/GBP ekes out a new six-month high at 0.8755 to close out a week of straight gains

  • The Euro has stepped higher against the Pound Sterling for five straight trading days.
  • The EUR/GBP briefly saw a fresh six-month high on Friday.
  • Economic data has mixed for both the EU and the UK, but the market's hat tip goes to the Euro.

The EUR/GBP wraps up another trading week just shy of 0.8750 after seeing five straight days of gains with the Pound Sterling (GBP) waffling against the Euro (EUR) for the entire week.

EU and UK economic data mixed on forecasts across the board this week, but it's getting difficult for investors to ignore the fact that UK data beats, even when they clear forecasts, still leaves economic indicators middling at best.

UK Gross Domestic Product (GDP) figures held steady for the year into September at 1.5% instead of declining to 1.1% as markets had expected, and UK Manufacturing Production for the same period held flat at 3% versus the expected growth to 3.1%, and the previous figure being revised from 28% to 3.0%.

Next Up: hectic data schedule for EU & UK

Next Tuesday sees UK labor and wage figures, while the EU will be releasing their own GDP figures for the third quarter. 

Wednesday delivers UK Consumer Price Index (CPI) inflation data, paired with EU Industrial production.

Next week will close out high-impact data with UK Retail Sales and EU Harmonized Index of Consumer Prices (HICP) on Friday.

EUR/GBP Technical Outlook

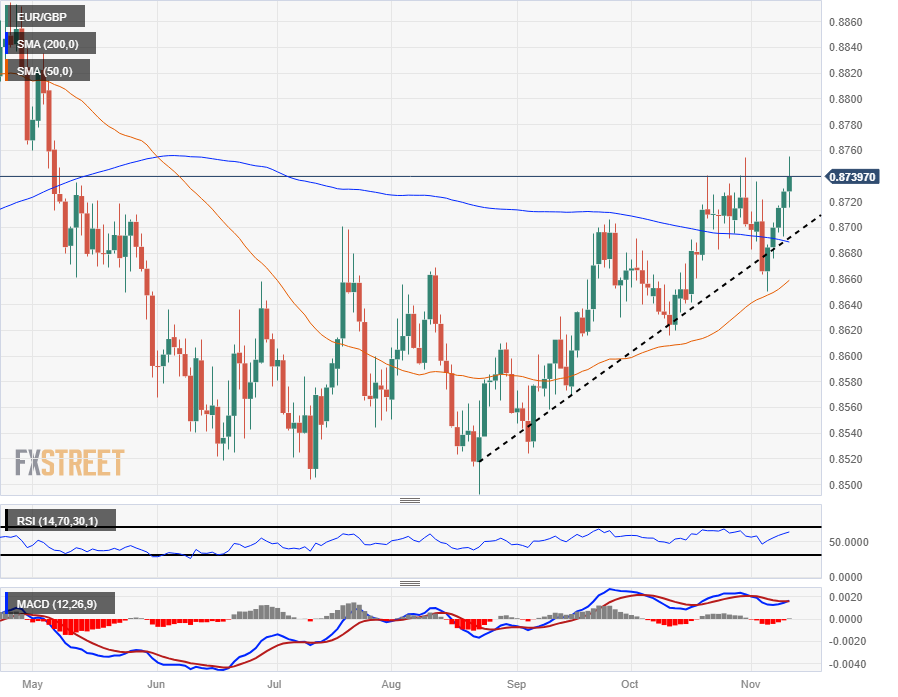
The EUR/GBP chalked in five straight green bars, climbing back over the 200-day Simple Moving Average (SMA) and pushing back into near-term high bids as the Euro rallies against the Pound Sterling.

The pair has continued to etch in higher lows along a rising trendline from August's low closes near 0.8520, and the 50-day SMA is accelerating from 0.8660 towards a bullish cross of the 200-day SMA, which is currently parked near 0.8690.

EUR/GBP Daily Chart

EUR/GBP Technical Levels

EUR/GBP

Overview
Today last price0.874
Today Daily Change0.0012
Today Daily Change %0.14
Today daily open0.8728
 
Trends
Daily SMA200.8698
Daily SMA500.8655
Daily SMA1000.862
Daily SMA2000.869
 
Levels
Previous Daily High0.873
Previous Daily Low0.8693
Previous Weekly High0.8754
Previous Weekly Low0.8664
Previous Monthly High0.8754
Previous Monthly Low0.8616
Daily Fibonacci 38.2%0.8716
Daily Fibonacci 61.8%0.8707
Daily Pivot Point S10.8704
Daily Pivot Point S20.868
Daily Pivot Point S30.8667
Daily Pivot Point R10.8741
Daily Pivot Point R20.8754
Daily Pivot Point R30.8778

Author

Joshua Gibson

Joshua joins the FXStreet team as an Economics and Finance double major from Vancouver Island University with twelve years' experience as an independent trader focusing on technical analysis.

More from Joshua Gibson
Share:

Editor's Picks

AUD/USD falls from 0.7050 amid Iran uncertainty

AUD/USD is back in the red, falling from 0.7050 in the Asian session on Friday, reversing the previous day's goodish rebound from a nearly two-month low amid a modest US Dollar uptick. Iran downplayed Trump's claim that a deal has been approved and said that key issues, including the Strait of Hormuz and frozen funds, remain unresolved. This keeps a lid on optimism, which, along with Fed rate-hike bets, revives USD demand and weighs on the pair.

USD/JPY recovers above 160.00 as Mideast woes persist ahead of BoJ

USD/JPY recovers ground above 160.00 in the Asian session on Friday. Economic risks due to uncertainty in the Middle East undermine the Japanese Yen, while lifting the safe-haven US Dollar (USD) amid the US-Iran standoff. This acts as a tailwind for the pair, though fears of intervention could limit deeper JPY losses and cap the pair's rebound ahead of the BoJ meeting next week.

Gold sticks to losses amid Iran peace deal doubts and hawkish Fed bets

Gold attracts some sellers near the $4,246-$4,247 region during the Asian session, stalling the previous day's solid recovery move from its lowest level since November 2025. Mixed signals regarding a potential US-Iran peace deal revive demand for the safe-haven US Dollar.

Pi Network: Bulls attempt comeback as bearish strength fades

Pi Network (PI) is trading at around $0.120 after a modest recovery the previous day. Despite this recent rebound, traders should be cautious as a scheduled unlock of 14.8 million PI tokens on Friday could limit the token's recovery potential by increasing market supply. Meanwhile, the technical outlook is showing early signs of fading bearish momentum, suggesting a short-term bounce.

U.S. economic outlook: The Warsh era starts with a great debate

Warsh is starting his tenure at the Fed during a transition of sorts. Given the prior FOMC statement and the countless Fed speakers we’ve heard from since then, it seems Fed officials are in the midst of shifting toward a more neutral policy stance.

4.2% headline, 0.2% core: Why the Fed's next hike may be targeting the wrong problem

May's CPI put headline inflation at 4.2% on the year, up from 3.8% in April and the hottest reading since April 2023, while core prices rose just 0.2% on the month, undershooting the 0.3% consensus and halving April's pace.