EUR/GBP edges lower ahead of UK economic data
- The EUR/GBP trades at 0.8532 reporting mild losses during Monday's session.
- Impending release of UK's January CPI and Q4 GDP due on Wednesday and Thursday might exert pressure on GBP.
- Markets anticipate the BoE to initiate rate cutting cycle later than Fed and ECB.
- ECB's easing cycle is expected to kick off in April.

In Monday's session, the EUR/GBP traded at a minimal loss at 0.8532. Underpinning the GBP stability is market anticipation of the Bank of England’s (BoE) delayed rate-cut cycle, overshadowing potential imminent UK economic headwinds. Conversely, inflation trends, coupled with easing cycle expectations, add an element of uncertainty for the Euro, potentially favoring EUR/GBP selling momentum.
In line with that, the GBP might face headwinds due to the anticipated release of January Consumer Price Index (CPI) and Q4 Gross Domestic Product (GDP) numbers, with the potential of the latter confirming a technical recession from 2023. However, the GBP has had a robust start to 2024, second only to the USD amongst G10 currencies as market expectations hint at the BoE initiating a rate-cutting cycle later than the Federal Reserve (Fed) and European Central Bank (ECB). On Tuesday, labor market data from January and December will also be looked upon.
For the ECB, markets bet on a 60% probability for a 25 bp rate cut in April and a total easing of 125 bp within the year.
EUR/GBP technical analysis
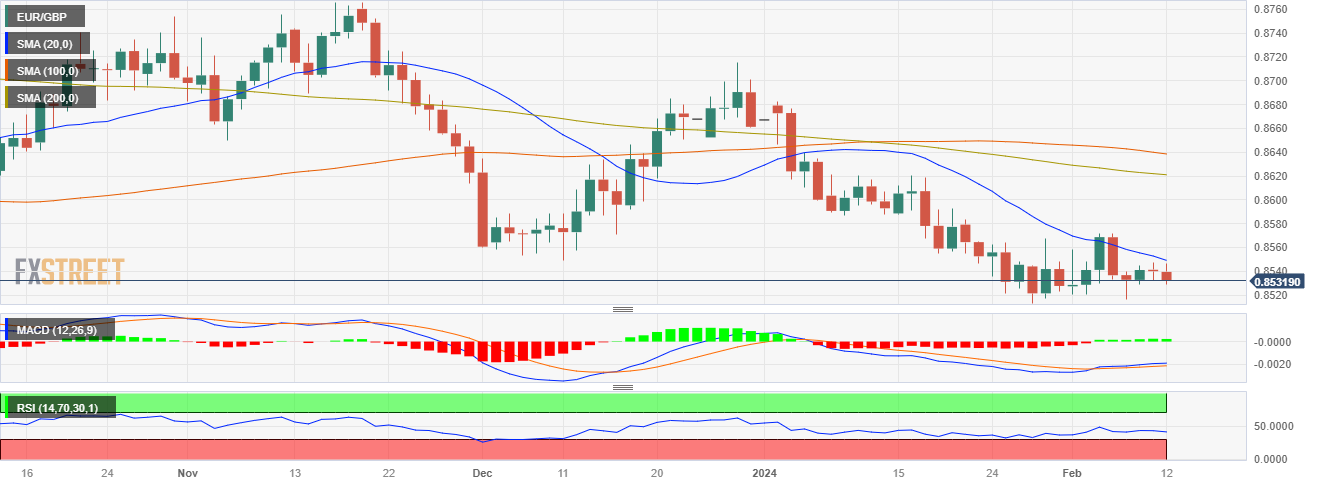
The Relative Strength Index (RSI) for the EURGBP pair is currently oscillating within the negative territory and the slope has been moderately positive, hinting at a slight shift of momentum from the sellers to the buyers over the recent days.
However, the Moving Average Convergence Divergence (MACD) histogram is printing flat green bars indicating that despite some buying pressure, sellers are still dominant. On the hourly chart, the RSI is also maintaining its position within the negative territory, and the MACD histogram continues to print red bars indicating that in the immediate short term, the sellers are also in control.
In the larger context, the EURGBP maintains its position below the 20, 100, and 200-day Simple Moving Averages (SMAs), reinforcing the dominant bearish outlook.
EUR/GBP daily chart
Author

Patricio Martín
FXStreet
Patricio is an economist from Argentina passionate about global finance and understanding the daily movements of the markets.


