|

EUR/GBP edges lower ahead of ECB decision

  • The EUR/GBP records 0.20% losses standing at 0.8562.
  • The ECB meets on Thursday, no policy change expected.
  • Daily chart indicators present bearish sentiment: RSI indicates a negative slope in unfavorable territory with MACD's rising red bars hinting at a selling momentum.

On Monday's session, the EUR/GBP pair was seen trading at the 0.8562 level, depicting a 0.20% loss. The daily chart indicates a neutral to bearish outlook with bulls struggling to find solid ground. On the four-hour chart, indicators suggest a flattened momentum within negative territory, pointing to a domination of sellers over buyers. Overall, the Pound seems to have a slight command over the Euro mainly due to the British economy holding stronger than the majority of the EU countries and markets betting on a more dovish European Central Bank (ECB).

In that sense, markets are pricing in the European Central Bank to begin its rate cuts in Q2, with nearly 150 bp of total easing seen this year due to the latest round of weak economic data. On Thursday the ECB meets,  were markets await the bank to hold its policy rate unchanged for the fourth consecutive time and investors will look for clues forward guidance, which may affect the crosses’s dynamics. As for the Bank of England (BoE), despite the relative robustness of the UK economy, market sentiments project the first rate cut in Q2, with approximately 125 bp of total rate cuts anticipated throughout the year.

EUR/GBP levels to watch

On the daily chart, the Relative Strength Index (RSI) is in a downward trajectory within the negative region, indicating an ongoing selling pressure. The positioning of the pair under the three key Simple Moving Averages (SMAs) - the 20, 100 and 200-day SMAs - corroborates this bearishness. This unfavorable climate is further solidified by the increasing red bars observed on the Moving Average Convergence Divergence (MACD) histogram.

Zooming into the four-hour chart, the indicators have stagnated within the negative arena, portraying a pause in the bearish momentum. The four-hour RSI is hovering flat in the negative space, yet the MACD histogram displays rising red bars. This suggests a lukewarm selling momentum, implying buyers yet have to exhibit concrete attempts to shift the scales.
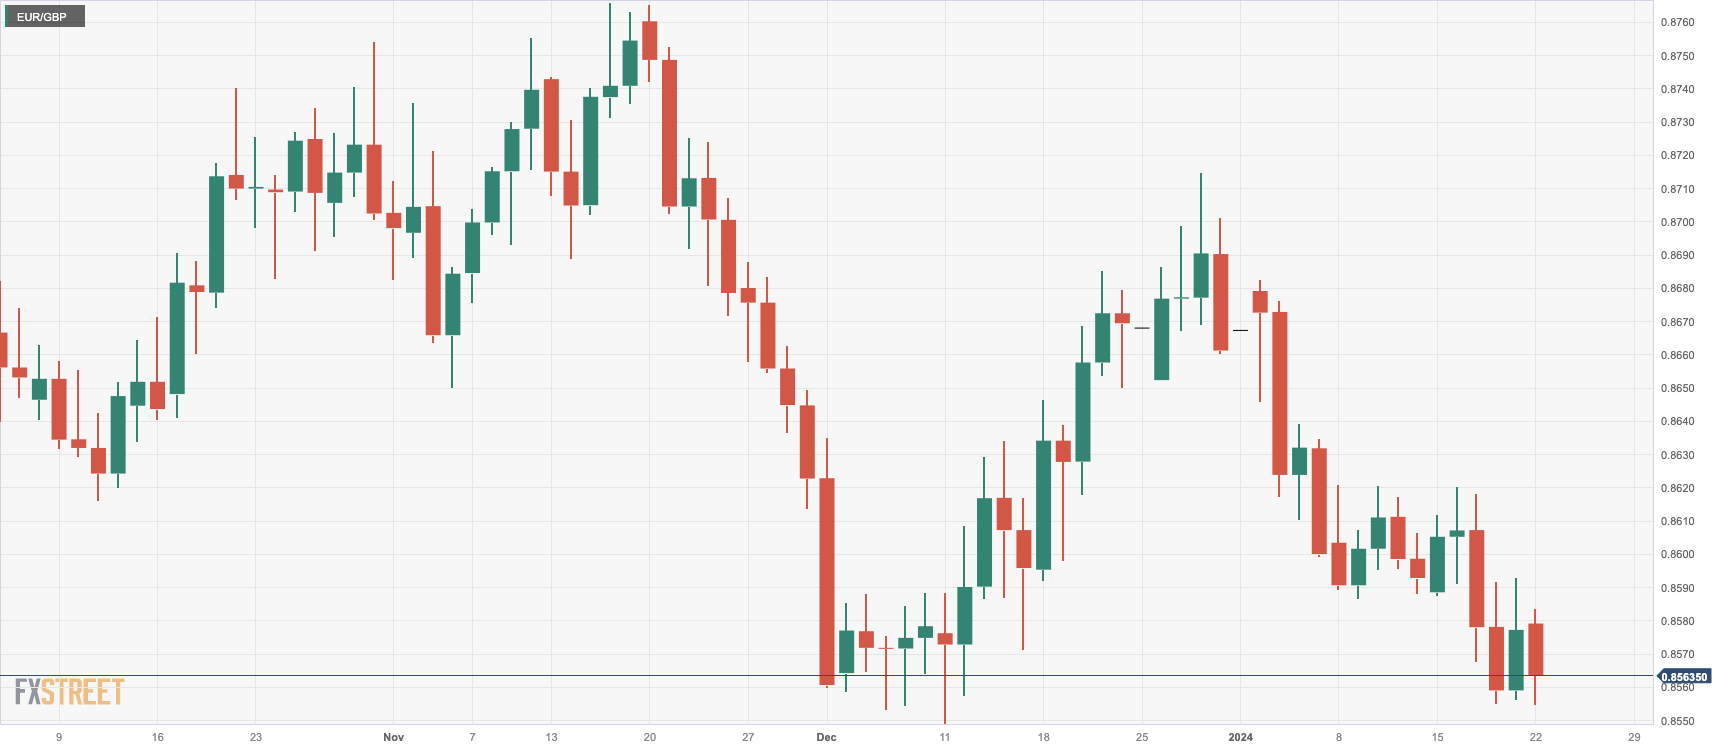
EUR/GBP

Overview
Today last price0.8563
Today Daily Change-0.0014
Today Daily Change %-0.16
Today daily open0.8577
 
Trends
Daily SMA200.8625
Daily SMA500.8639
Daily SMA1000.8649
Daily SMA2000.8642
 
Levels
Previous Daily High0.8593
Previous Daily Low0.8556
Previous Weekly High0.862
Previous Weekly Low0.8555
Previous Monthly High0.8715
Previous Monthly Low0.8549
Daily Fibonacci 38.2%0.8579
Daily Fibonacci 61.8%0.857
Daily Pivot Point S10.8558
Daily Pivot Point S20.8539
Daily Pivot Point S30.8521
Daily Pivot Point R10.8595
Daily Pivot Point R20.8612
Daily Pivot Point R30.8632

EUR/GBP daily chart

Author

Patricio Martín

Patricio is an economist from Argentina passionate about global finance and understanding the daily movements of the markets.

More from Patricio Martín
Share:

Editor's Picks

EUR/USD stays well offered below 1.1800

The selling pressure on EUR/USD is picking up pace, with the pair slipping decisively below the key 1.1800 level and sliding to fresh two week lows as Wednesday’s session draws to a close. The move lower comes as the US Dollar finds renewed strength after the latest round of US data and the release of the FOMC Minutes. Next of note on the docket will be the US weekly Initial Jobless Claims.
 

GBP/USD reaches multi-day lows near 1.3500

GBP/USD reverses its initial upside momentum and is now adding to previous declines, approaching the 1.3500 region on Wednesday. Cable’s downtick comes on the back of decent gains in the Greenback and easing UK inflation figures, which seem to have reinforced the case for a BoE rate cut in March.

Gold battle to regain $5,000 continues

Gold is back on the front foot on Wednesday, shaking off part of the early week softness and challenging two-day highs near the $5,000 mark per troy ounce. The move comes ahead of the FOMC Minutes and is unfolding despite an intense rebound in the US Dollar.

Bitcoin has found or is near a bottom, extended consolidation to follow: K33

Bitcoin (BTC) is nearing or has already established a bottom, which could be followed by a sustained period of slow price movement, according to K33.

Mixed UK inflation data no gamechanger for the Bank of England

Food inflation plunged in January, but service sector price pressure is proving stickier. We continue to expect Bank of England rate cuts in March and June. The latest UK inflation read is a mixed bag for the Bank of England, but we doubt it drastically changes the odds of a March rate cut.

Sui extends sideways action ahead of Grayscale’s GSUI ETF launch

Sui is extending its downtrend for the second consecutive day, trading at 0.95 at the time of writing on Wednesday. The Layer-1 token is down over 16% in February and approximately 34% from the start of the year, aligning with the overall bearish sentiment across the crypto market.