|

EUR/CHF Price Forecast: Correction looks close to completion, bull move to likely resume

  • EUR/CHF has unfolded a correction over the last four days. 
  • This move now looks almost complete and the bullish prior move is likely to resume. 

EUR/CHF pulls back in the middle of a recovery rally. Despite the overall bearish medium-term trend the pair is showing signs it could press higher in the short-term.

EUR/CHF Daily Chart 

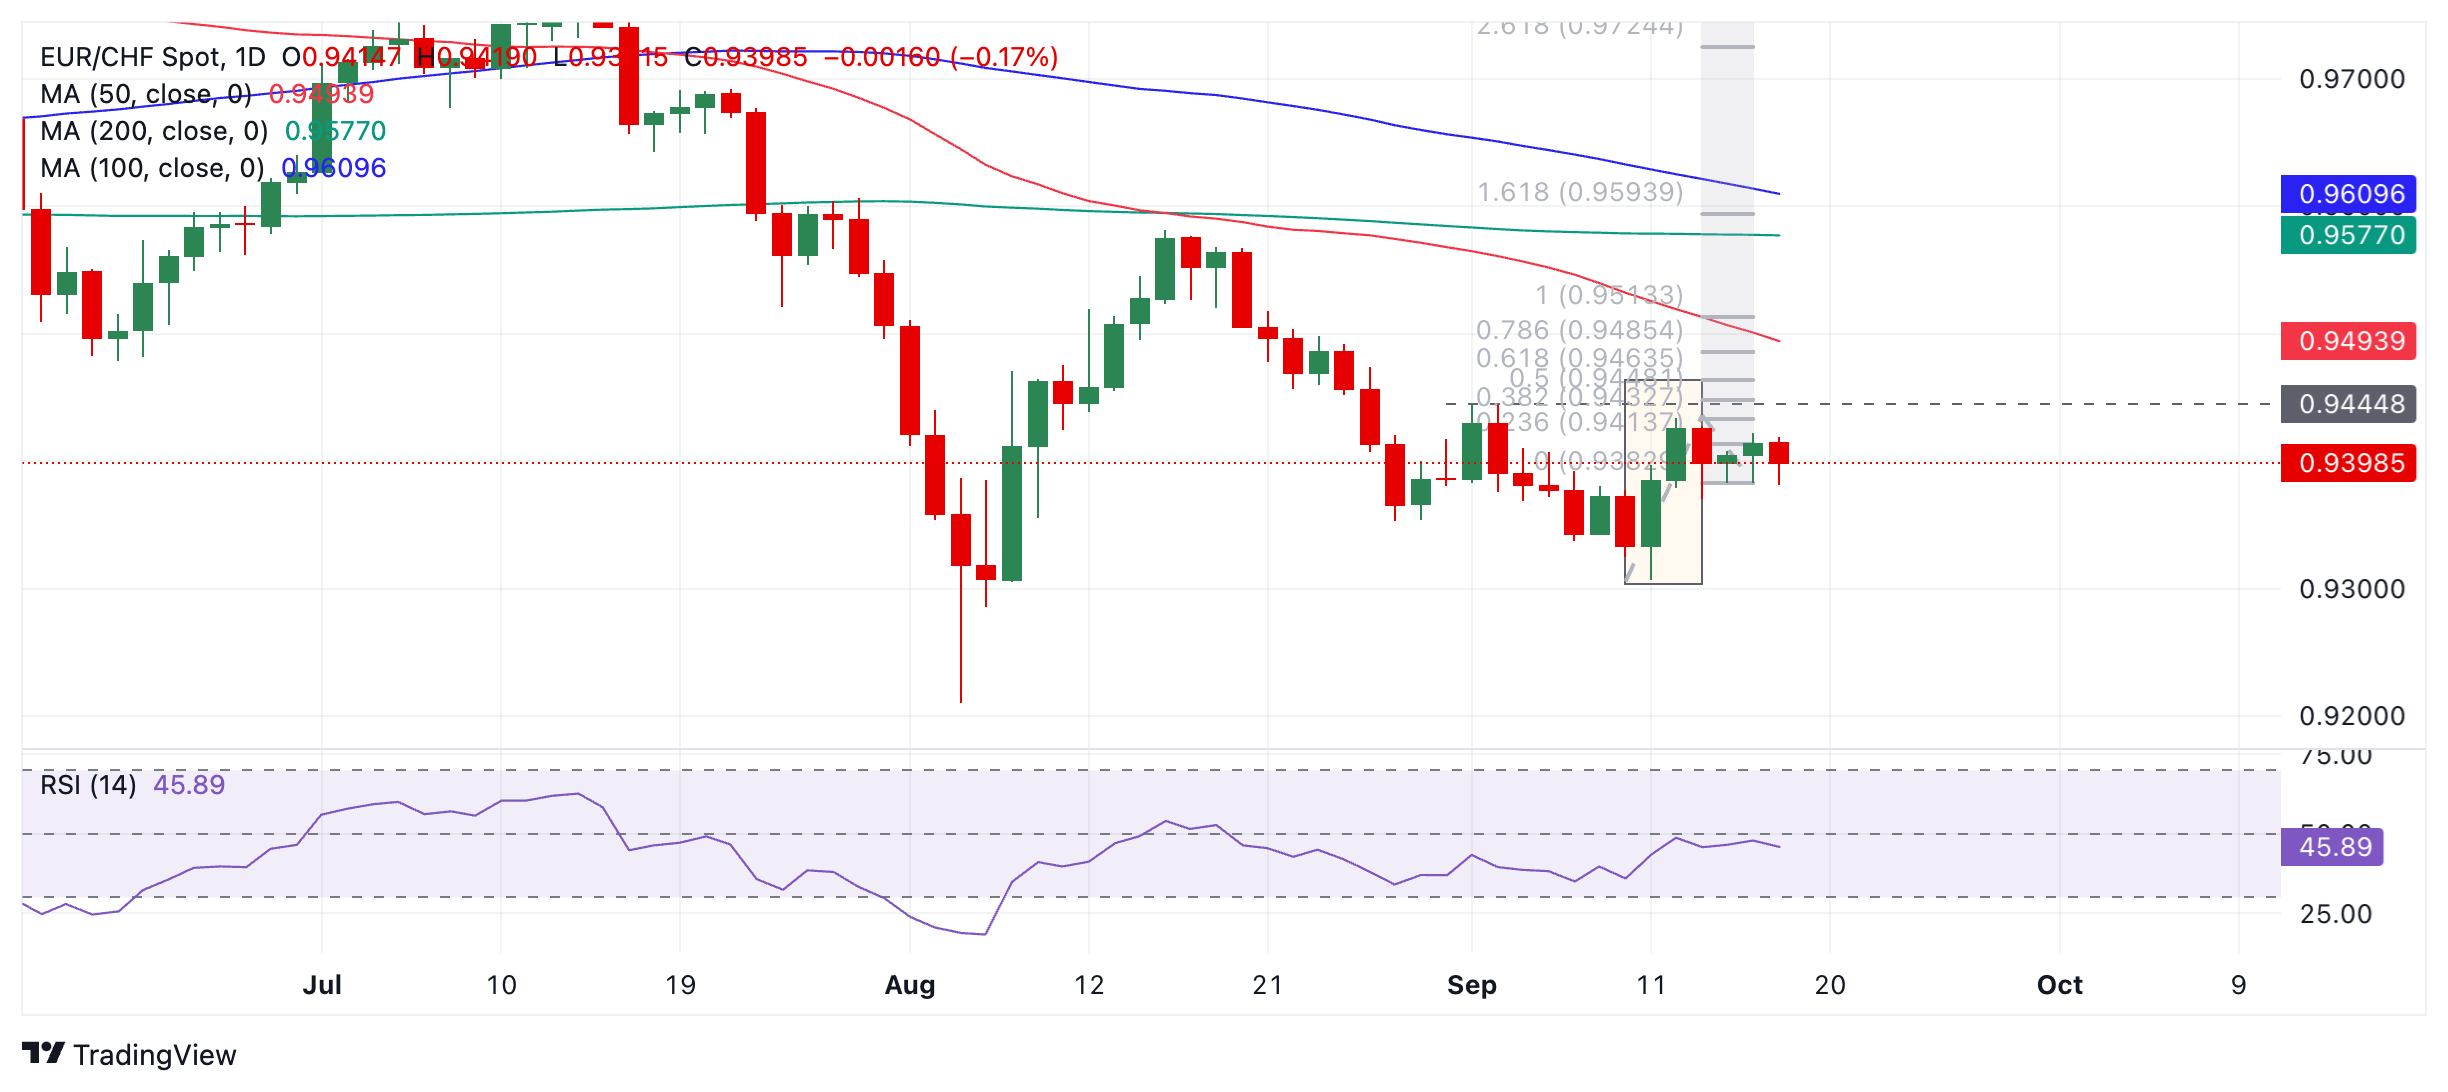
EUR/CHF formed a Bullish Engulfing Japanese candlestick pattern on the day it bottomed on September 11 (shaded rectangle). This happens when price reaches a new low in a downtrend, reverses during the same day and closes higher. When the body of the recovery candle encompasses – or “engulfs” – the whole of the previous day’s body it is known in technical analysis as a Bullish Engulfing. The following day was a green up day adding confirmation to the Bullish Engulfing. The whole pattern is a short-term bullish signal. 

Not long after the recovery, the pair pulled back on September 12, however, the correction has been shallow and seems to have traced out a vague three-wave corrective pattern. This suggests the bullish rebound will probably resume. The correction also looks close to completion. 

A break above 0.9434 (September 12 high) would confirm a continuation higher, with the next target at 0.9464, followed by 0.9513 in the case of a particularly bullish move. 

A break below 0.9369 would probably invalidate the bullish hypothesis and suggest a more neutral or bearish outlook.

Author

Joaquin Monfort

Joaquin Monfort is a financial writer and analyst with over 10 years experience writing about financial markets and alt data. He holds a degree in Anthropology from London University and a Diploma in Technical analysis.

More from Joaquin Monfort
Share:

Editor's Picks

AUD/USD eyes 0.7150 barrier nine-day EMA

AUD/USD inches higher after registering modest losses in the previous day, trading around 0.7130 during the Asian hours. The technical analysis of the daily chart indicates that the pair is moving sideways within the rectangle pattern, suggesting a consolidation as neither the bulls nor the bears have enough momentum to take control of the market.

USD/JPY trades below 160.00 intervention threshold; bullish bias intact

The USD/JPY pair attracts some sellers during the Asian session amid fears that authorities will step in again to prop up the Japanese Yen. Furthermore, the Israel-Lebanon truce prompts some profit-taking around the US Dollar and exerts downward pressure on the currency pair.

Gold extends rebound to $4,500 as US yields edge lower

Gold (XAU/USD) preserves its recovery momentum following Wednesday's slide and tests the $4,500 mark in the second half of the day on Thursday. While US-Iran uncertainty remains, easing tensions between Lebanon on Israel seems to be helping the market mood improve, causing the USD to lose strength alongside falling US T-bond yields and opening the door for a decisive rebound in XAU/USD.

Bitcoin’s massive storm is back: Why the sell-off is far from over

Bitcoin price action over the last few weeks has felt less like a normal, healthy correction and more like a slow grinding crash that continues to wreak havoc on holdings and trading accounts. And everything suggests that the dramatic crash isn’t over.

Nonfarm payrolls: Testing the limits of Fed policy patience

The upcoming nonfarm payrolls report for May will provide the final update on the US labor market before Kevin Warsh attends his first policy meeting as the new Fed Chair later this month.

Recession on paper: What really moves the Canadian Loonie now?

Statistics Canada handed the headline writers a gift and the analysts a headache. Real GDP shrank 0.1% on an annualized basis in the first quarter, and with the fourth quarter of 2025 revised down to a 1.0% contraction, that is two negative quarters in a row, the textbook definition of a technical recession and Canada's first since the pandemic.